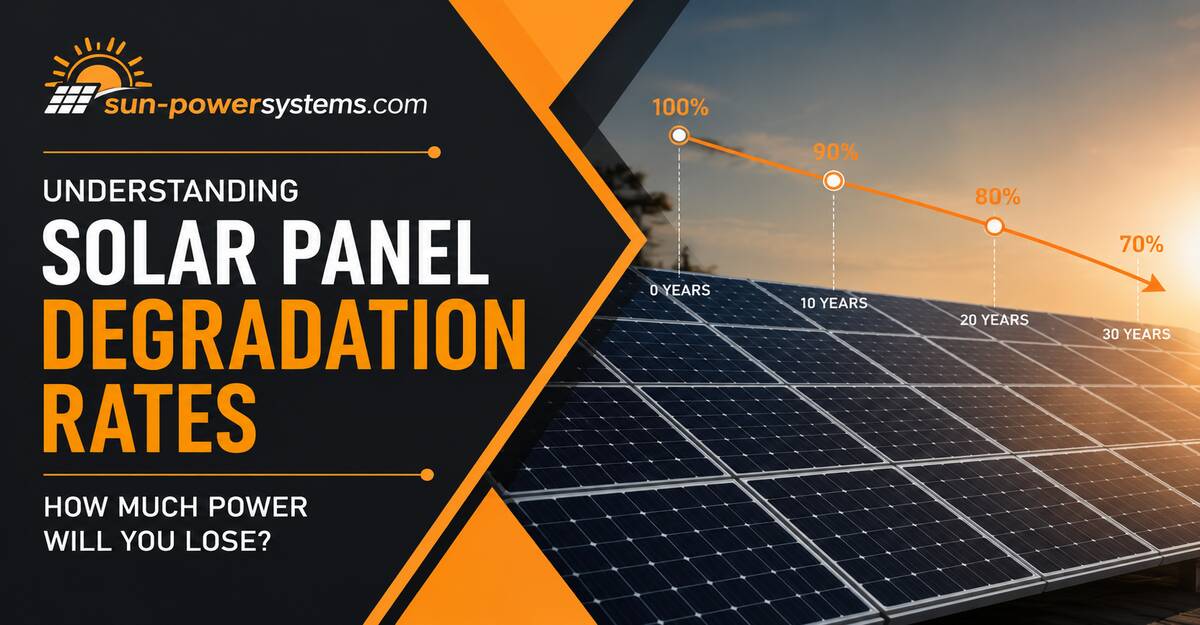
Solar panel degradation is the permanent, irreversible loss of power output as a panel ages. Modern panels degrade at a median of about 0.5% per year, so a well-built system retains roughly 85% to 92% of its original nameplate capacity after 25 years. In practice, you lose 8% to 15% of your starting output over that lifetime.
Key Facts at a Glance
- The industry median degradation rate in 2026 is 0.5% per year; the mean is higher (~0.75%) because a minority of poorly built systems drag the average up.
- Degradation is not linear: most panels take a larger one-time hit in year one, then decline slowly and steadily thereafter.
- N-type panels (TOPCon, HJT, IBC) carry no boron-oxygen defect, and modern gallium-doped p-type PERC has also nearly eliminated it since ~2021.
- Heat is the single biggest accelerant: panels running above 65°C in desert climates can degrade at 0.9%–1.2% per year instead of 0.5%.
- A 25-year power warranty guaranteeing ≥ 87% output is now standard; premium panels guarantee ≥ 92%.
- Whole-system degradation is worse than module degradation, because inverter aging, wiring, and soiling losses stack on top.
What Is a Solar Panel Degradation Rate?
A solar panel degradation rate is the percentage of rated power a panel permanently loses each year. It is measured against the panel’s nameplate capacity under Standard Test Conditions and expressed as an annual figure, most commonly 0.25% to 0.70% for modern crystalline-silicon modules.
This figure is distinct from temporary losses. Soiling (dust, pollen, bird droppings) and thermal derating (reduced output on a hot afternoon) both reduce power, but both are fully recoverable — a rinse or a cool evening restores output. Degradation does not recover. When people ask “how much power will I lose,” they are really asking two separate questions: how much permanent loss the cells accumulate, and how much apparent loss comes from recoverable factors that good maintenance can erase.
The number matters because it compounds. A panel losing 0.5% a year is not 12.5% weaker after 25 years by simple multiplication — it is closer to 88% of original output because each year’s loss applies to a slightly smaller base. That compounding is exactly why utility developers fight over tenths of a percent.
How Does Solar Panel Degradation Actually Happen?
Solar panels degrade through three overlapping mechanisms that unfold on different timescales: a fast chemical hit in the first days, a slower thermal-chemical stress over the first few years, and steady environmental weathering over the remaining decades. Cell architecture determines how severe each phase is.
Phase 1 — Initial Light-Induced Degradation (First Days)
Light-Induced Degradation (LID) is a one-time drop that happens within hours of a legacy boron-doped p-type panel’s first sun exposure. Trace oxygen in the silicon bonds with boron dopants to form boron-oxygen defects that trap charge carriers, cutting efficiency by 1% to 3% permanently.
Here is the correction the AI Overview misses: most p-type panels made since roughly 2021 are gallium-doped, not boron-doped, and gallium doping suppresses this defect almost entirely, cutting LID to well under 1%. N-type panels are phosphorus-doped and skip the phase entirely. So the “p-type always loses 1–3% in week one” claim is true of legacy modules but outdated for current-production gallium-doped PERC. If you are buying new panels, LID is largely a solved problem across the board.
Phase 2 — Light and Elevated Temperature Induced Degradation (Years 1–3)
LeTID is driven by sustained heat plus sunlight, which mobilizes hydrogen atoms inside the wafer and creates recombination-active defects. In unmitigated cells this once caused a cumulative 5% to 10% loss before stabilizing around year three.
In practice, tier-one manufacturers now apply hydrogenation and firing-profile controls that keep LeTID under 1% to 2% in modern PERC and near zero in TOPCon and HJT. Treat the 5–10% figure as a worst-case for cheap, unbranded modules — not a spec you should expect from a reputable panel.
Phase 3 — Long-Term Environmental Weathering (Years 4–30+)
After the chemistry settles, three physical drivers cause the slow, linear decline that dominates a panel’s life:
- Thermal cycling: daily heating and cooling makes materials expand and contract, stressing solder joints and seeding microcracks in the silicon.
- UV degradation of the encapsulant: ultraviolet light yellows or browns the ethylene-vinyl acetate (EVA) polymer that laminates the cell, cutting light transmission.
- Moisture ingress: water vapor creeps past edge seals and corrodes the silver gridlines and contacts, and — under system voltage — drives Potential-Induced Degradation (PID).
These are the mechanisms your warranty is really insuring against, because they never stop for the life of the array.
Which Panel Types Degrade the Slowest?
N-type back-contact (IBC) and heterojunction (HJT) panels degrade the slowest, at roughly 0.24%–0.35% per year, while legacy p-type PERC degrades fastest at 0.50%–0.70%. TOPCon sits in the middle and has become the mainstream standard because it captures most of the N-type benefit at a modest price premium.
The table below anchors the differences to specific values. Note that warranty end-of-life percentages assume a larger year-one step followed by the annual rate shown.
| Parameter | P-type PERC (legacy) | N-type TOPCon (standard) | N-type HJT (premium) | N-type IBC (elite) |
|---|---|---|---|---|
| Year-1 degradation | 1.0%–2.0%* | ~0.5% | ~0.5% | ~0.5% |
| Annual rate (Y2–25) | 0.50%–0.70% | ~0.40% | ~0.35% | ~0.30% |
| 25-yr warranted output | ~84%–86% | ~89%–90% | ~91%–92% | ~92%–93% |
| Temperature coefficient | −0.34%/°C | −0.30%/°C | −0.25%/°C | −0.24%/°C |
| Module cost per watt | $0.07–$0.10 | $0.09–$0.12 | $0.14–$0.20 | $0.14–$0.20 |
*Legacy boron-doped PERC hit 2%–3%; current gallium-doped PERC is closer to 1%.
The temperature coefficient row is the underrated one. A lower coefficient means the panel loses less instantaneous output for every degree above 25°C, so in a hot climate an HJT panel both produces more each day and ages more slowly than a PERC panel of the same wattage. That compounding advantage is why HJT wins in the Gulf, the US Southwest, and equatorial installations despite its higher sticker price.
How Much Power Will You Actually Lose?
To calculate remaining output, apply the annual degradation rate to the year-one figure using compounding: Remaining % = (1 − year-1 loss) × (1 − annual rate)^(years − 1). For a modern TOPCon panel losing 0.5% in year one and 0.4% annually after, you retain about 90.5% of nameplate output at year 25.
Here is a worked example for a 10 kW residential system:
- Year 0: 10,000 W nameplate.
- After year 1 (0.5% step): ~9,950 W effective.
- After year 10: ~9,600 W (about 4% total loss).
- After year 25: ~9,050 W (about 9.5% total loss).
Over 25 years, that TOPCon system loses roughly 950 W of capacity. A legacy PERC system in the same spot might lose 1,500 W. In annual energy terms, if the array produced 14,000 kWh in year one, it produces around 12,700 kWh in year 25 — still the large majority of its original yield.
One honest caveat practitioners rarely state: module degradation is only part of your real loss. Whole-system output also erodes from inverter aging (inverters often need replacement around year 12–15), connector oxidation, and rising baseline soiling. Field studies of complete systems frequently measure 0.7%–1.0% annual system decline even when the panels themselves degrade at 0.5%. Budget for the system number, not just the module number.
Does Climate Change How Fast Panels Degrade?
Yes — local climate can nearly double the degradation rate. Heat, UV intensity, and humidity are the accelerants, so hot deserts and humid tropics punish panels far harder than temperate regions, where rates often beat the 0.5% median.
- The desert penalty (heat + UV): In arid regions where module temperatures routinely exceed 65°C, encapsulant browning and microcracking accelerate, pushing PERC degradation to 0.9%–1.2% per year.
- The tropical penalty (heat + humidity): Continuous moisture drives gridline corrosion and PID, which can silently strip 10%–20% of a string’s output within a few years if the modules aren’t PID-resistant.
- The temperate advantage: In mild, dry-summer climates, well-built modern panels frequently degrade below 0.4% per year — beating their own warranties.
This is why the same panel model can carry very different real-world life expectancies depending on where it’s mounted, and why buyers in hot or humid climates should demand a POE (polyolefin) encapsulant instead of standard EVA and independently verified PID resistance.
Why Do Real Panels Often Outlast Their Warranties?
Manufacturer degradation warranties are deliberately conservative, so quality panels usually degrade slower than the guaranteed rate. A warranty is a legal floor the maker is confident it will never breach, not a prediction of typical performance — which gives you a built-in safety margin.
NREL’s long-running field analysis found a median degradation of about 0.5% per year across thousands of systems, but the distribution is skewed: the best 25% of systems degrade under 0.2% per year, while a poorly built minority pulls the mean up toward 0.75%. In other words, buying a reputable brand doesn’t just lower your expected rate — it also removes you from the tail of catastrophic early failures that inflate the averages. This is the strongest practical argument against the cheapest available panel: you are mostly paying to avoid the bad tail.
What Mistakes Accelerate Degradation?
The fastest way to void your warranty and shorten panel life is thermal-shock cleaning, abrasive cleaning, and trapping heat under the array. All three are avoidable, and all three are common.
- Thermal-shock cleaning: Spraying cold water on hot panels at midday causes rapid glass and wafer contraction, seeding widespread microcracks. Clean in early morning or evening only.
- Abrasive cleaning: Dry brushes or miscalibrated cleaning robots strip the anti-reflective coating, causing a 3%–4% permanent efficiency loss. Use soft brushes and deionized water.
- Restricting airflow: Flush-mounting panels without a 3-to-6-inch ventilation gap traps heat and permanently accelerates thermal aging of the backsheet and encapsulant.
The counterintuitive lesson: over-aggressive maintenance damages panels faster than benign neglect. Panels are engineered to sit in weather for decades; they are not engineered to survive a pressure washer.
How Do You Diagnose Whether Loss Is Permanent?
To tell permanent degradation from recoverable loss, work from cheapest test to most technical: clean the panels first, then scan the inverter for PID, then thermal-image for microcracks. Only losses that survive a cleaning are true degradation.
- Rule out soiling. If washing the array restores the expected power curve, the loss was reversible dirt, not degradation.
- Scan for PID. An unexpected, steep 20%+ loss across a whole string in the first few years points to Potential-Induced Degradation. Check inverter logs for leakage current between frame and cells; many modern inverters can run an overnight PID-recovery mode that partially reverses the ion migration.
- Image for microcracks. On a clear afternoon, a handheld thermal camera reveals sharp localized hotspots where individual cells or failing bypass diodes are working against microcracks. These are permanent.
Keep a baseline: an electroluminescence (EL) image and a production reading from commissioning is the single most useful record you can have. Without a documented starting point, proving a warranty-breaching degradation rate years later is nearly impossible — the manufacturer will simply dispute your reference.
What Degradation Rate Should You Demand When Buying?
Demand a warranted annual degradation of ≤ 0.4% for residential and commercial systems, and ≤ 0.30% for utility-scale assets. Pair that with a POE encapsulant and, for large projects, independent third-party degradation verification rather than the manufacturer’s own datasheet.
- Homeowners: N-type TOPCon is the sweet spot — near-premium longevity at mainstream pricing. Ask for ≤ 0.4% annual and a POE (not EVA) encapsulant for moisture protection.
- Commercial and industrial: Bifacial TOPCon or HJT maximizes energy per square meter on constrained roofs. Require compliance with IEC/TS 63209-1 extended-stress testing (2,000-hour damp-heat and thermal-cycling validation).
- Utility-scale asset managers: For 25-to-30-year power-purchase agreements, small rate differences swing millions in cumulative revenue — a 0.2% lower annual rate can preserve on the order of $2–3M per 100 MW over the contract. Insist on an independently verified ≤ 0.25%–0.30% rate and baseline EL imaging at commissioning for future warranty enforcement.
What Degradation Is Not Good For Explaining
Degradation rates should not be used to predict the exact output of a specific system on a specific day. The annual rate is a long-run average; real output on any given date is dominated by weather, soiling, temperature, and shading — all of which swamp a 0.5% yearly trend in the short term.
Degradation also doesn’t mean a panel “dies” at 25 years. The warranty end is a financial marker, not a failure point. A panel warranted to 88% at year 25 keeps producing at ~85% at year 30 and often past year 35 — just with no remaining guarantee. For used or secondhand panels, this is the key insight: a decade-old quality panel may still deliver 90%+ of nameplate and remain a legitimate buy, provided you can verify its history and inspect for microcracks.
Frequently Asked Questions
Is a 0.5% degradation rate good? Yes. 0.5% per year is the current industry median and a solid result for a mainstream panel. Premium N-type modules do better at 0.25%–0.35%, while anything above 0.8% per year signals a low-quality module or a harsh climate and should give you pause.
Do solar panels stop working after 25 years? No. The 25-year mark is when the power warranty typically ends, not when the panel fails. Most quality panels keep producing at 80%–87% of original output well past 30 years, simply without a remaining performance guarantee.
Does degradation happen in a straight line? Not exactly. Most panels take a larger one-time hit in the first year (from LID and early stabilization), then settle into a slow, near-linear decline. That’s why warranties quote a separate year-one figure and a lower annual rate afterward.
Can solar panel degradation be reversed? Mostly no. True degradation from microcracks, encapsulant browning, and corrosion is permanent. The exception is PID, which specialized inverters can partially reverse overnight by reversing the harmful ion migration inside the cells.
Do cheaper panels degrade faster? Often, yes. Budget panels are more likely to skip LeTID mitigation, use cheaper EVA encapsulant, and land in the poorly-performing tail that pushes industry averages up. Paying for a tier-one brand mainly buys you insurance against early, catastrophic degradation.
How do I claim a degradation warranty? You must prove output has dropped below the warranted curve, which requires a documented baseline (commissioning production data and ideally an EL image), then flash-test or field-measurement evidence, submitted per the manufacturer’s process. Without a baseline, most claims fail on lack of proof.
The Bottom Line on Solar Panel Degradation Rates
Solar panel degradation rates tell you how much permanent power you’ll lose each year — a median of 0.5% for modern panels, leaving 85% to 92% of output after 25 years. Choose N-type TOPCon or better, insist on a POE encapsulant and a verified rate, avoid thermal-shock and abrasive cleaning, and keep a commissioning baseline. Do that, and degradation becomes a slow, predictable, well-insured cost rather than a threat to your investment.