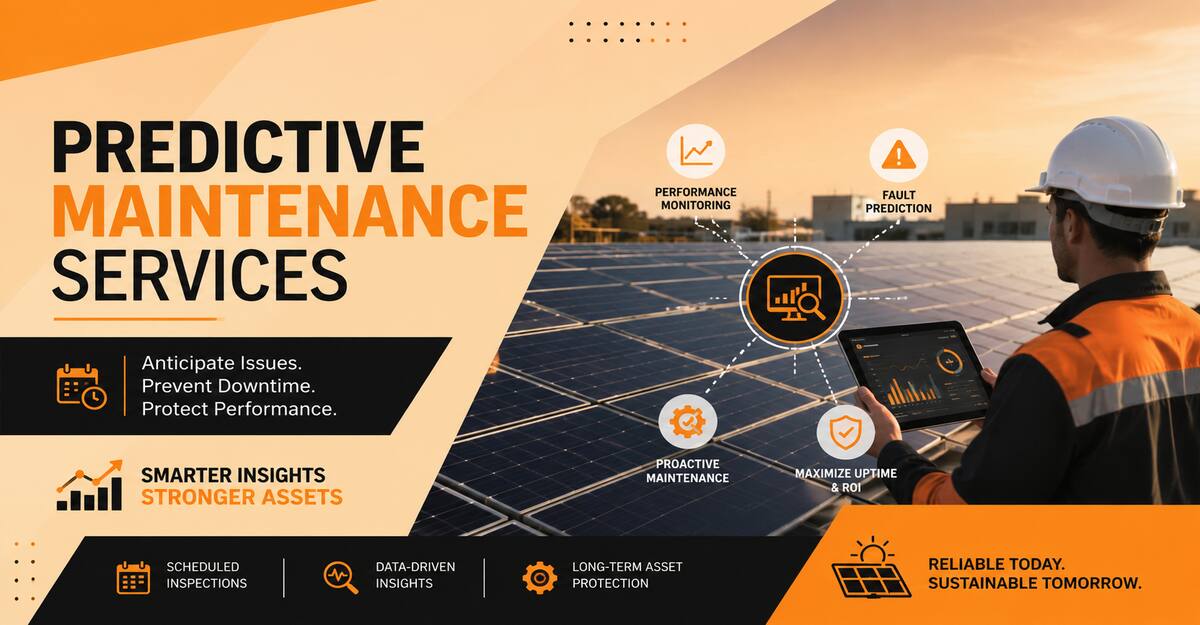
Predictive maintenance (PdM) for commercial solar assets is a data-driven operational strategy that uses real-time telemetry, artificial intelligence, and digital twins to detect equipment degradation and forecast failures before they cause system downtime. By analyzing data directly from inverters, smart combiners, and weather stations, this methodology allows asset owners to dispatch technicians specifically to the degraded component, eliminating unnecessary truck rolls and preventing catastrophic hardware loss.
Key Facts / At a Glance:
- Mean Time to Repair (MTTR): Reduces average repair windows to under 24 hours.
- O&M Cost Reduction: Decreases operational and maintenance spending by 25% to 40% annually.
- Asset Uptime: Achieves 99.2% to 99.8% fleet availability.
- Payback Period: Yields a return on investment within 14 to 22 months.
- Yield Improvement: Recaptures 2% to 7% in annual energy production otherwise lost to undetected faults.
What Are Predictive Maintenance Services for Commercial Solar?
Predictive maintenance services for commercial solar portfolios represent a fundamental shift from calendar-based servicing to condition-based intervention. Rather than washing panels or testing inverters on a fixed biannual schedule, PdM software continuously ingests live operational data from the solar plant. The software applies machine learning algorithms to this data to identify statistical anomalies. When a specific string of panels begins underperforming relative to exact real-time weather conditions, the system generates an automated work order.
This approach targets the exact location of the anomaly. If a bypassed diode fails on a specific module, the platform alerts the operations center with the exact string location, the severity of the fault, and the estimated time until complete failure. This precision keeps healthy assets online and focuses labor exclusively on components requiring immediate attention.
How Does Commercial Solar Predictive Maintenance Work?
Commercial solar predictive maintenance works by transforming raw Supervisory Control and Data Acquisition (SCADA) telemetry into highly accurate, automated field service schedules. The foundation of this system relies on a continuous loop of data ingestion, baseline comparison, and anomaly alerting.
The core engine operates through four distinct layers. First, physical system components stream performance telemetry into a centralized cloud database via edge-computing gateways. Second, artificial intelligence creates a “digital twin.” This digital twin is a dynamic, mathematically perfect simulation of how the specific solar plant should perform at that exact second under the current irradiance and temperature. Third, machine learning algorithms compare the live SCADA metrics against the digital twin’s baseline to detect deviations. Finally, the system flags the specific component, calculates the degradation level, and issues a time-to-failure (TTF) alert.
Which Data Streams Power the Analytics Engine?
Predictive engines require high-fidelity data to avoid false positives. The most effective platforms aggregate Direct Current (DC) string voltage, Alternating Current (AC) output, inverter internal temperatures, irradiance levels from local pyranometers, and module back-temperature readings. The software standardizes varying industrial data protocols (such as Modbus TCP/IP and OPC UA) into a unified JSON format for cloud processing.
What Are the Core Technologies Powering Solar PdM?
Solar asset managers rely on three primary technological layers to capture the physical reality of the plant and feed it into the predictive engine.
Aerial Infrared (IR) Thermography
Aerial IR thermography utilizes commercial drones equipped with radiometric thermal sensors to fly automated grid patterns over solar arrays. This technology pinpoints sub-module anomalies like cell-level hot spots, bypassed diode failures, string mismatches, and physical micro-cracking. Utility-scale plants and sprawling Commercial and Industrial (C&I) rooftop portfolios typically deploy drone thermography twice per year to catch physical degradation that electrical telemetry cannot isolate.
Inverter Telemetry Analytics
Inverter telemetry analytics relies on AI models to continuously parse DC to AC conversion efficiency, insulation resistance (Riso), and voltage ripples. This data stream identifies IGBT transistor degradation, cooling fan failures, and grid voltage instability. Continuous automated tracking across all solar sites utilizing smart central or string inverters provides the highest return on investment by protecting the most expensive failure points in the system.
Smart Combiner Box and String Monitoring
Smart combiner string monitoring uses high-granularity current and voltage (I-V) curve tracers to monitor energy production down to the individual panel string level. This level of granular detection discovers localized soiling patterns, tracking-motor misalignment, sub-surface Potential Induced Degradation (PID), and localized connector corrosion. High-irradiance geographic regions prone to severe environmental dust or extreme weather benefit most from this string-level visibility.
How to Implement Predictive Maintenance Across Your Solar Portfolio
Transitioning a commercial solar portfolio to a predictive model requires a structured deployment sequence. Rushing the software integration without auditing the physical hardware results in dirty data and unusable alerts.
Step 1: Asset Audit and Digitization
Map all physical components across the portfolio to establish a unified digital hierarchy. Verify your existing SCADA system compatibility and identify data gaps in legacy hardware. You will likely need to install edge-computing IoT gateways to bridge older inverters to modern cloud platforms.
- Specifics: Document exact inverter firmware versions and establish a standardized naming convention for every string and combiner box.
- Success Checkpoint: You will know it worked when your cloud dashboard successfully pings every targeted inverter and receives a response packet within two seconds.
- Common Mistake: Failing to map the exact physical GPS location of individual strings, resulting in technicians wandering the site looking for the anomaly.
Step 2: Centralized Data Integration
Consolidate historical maintenance logs into a single cloud repository and establish secure API connections between inverter web portals and the new PdM platform. Integrate local satellite or on-site meteorological station weather feeds to provide the environmental context required for the digital twin.
- Specifics: Map legacy Modbus RTU registers to the modern MQTT data payloads required by the cloud engine.
- Success Checkpoint: Weather data and inverter output data align perfectly on the exact same time-series timestamp in the database.
- Common Mistake: Relying on satellite weather data for plants located in micro-climates, leading the AI to assume the panels are underperforming when a localized cloud is simply blocking the sun.
Step 3: Machine Learning Model Training
Ingest six to twelve months of historical baseline data to train the algorithms on normal weather-adjusted string outputs. Map known past inverter fault signatures into the AI profile so the system learns what a failure looks like for your specific hardware.
- Specifics: Set dynamic threshold tolerances based on seasonal variances (for example, allowing higher inverter temperatures in July before triggering an alarm).
- Success Checkpoint: The software accurately retroactively “predicts” historical failures that you already have documented in your maintenance logs.
- Common Mistake: Training the model using data from a period where the panels were heavily soiled, causing the AI to accept degraded performance as the normal baseline.
Step 4: Automated CMMS Interfacing
Link the PdM analytics engine to your Computerized Maintenance Management System (CMMS) to automate workflows. Create automated work-order generation rules for specific alerts and build custom dashboards tailored to asset managers and field technicians.
- Specifics: Establish escalation protocols for high-priority safety anomalies, routing critical thermal events directly to a supervisor’s mobile device.
- Success Checkpoint: A simulated inverter fan failure in the PdM software instantly creates an open ticket in the CMMS with the correct replacement part number attached.
- Common Mistake: Forwarding every minor voltage fluctuation to the CMMS, overwhelming the maintenance team with low-priority tickets.
Step 5: Continuous Loop Optimization
Track technician field findings to verify algorithm alert accuracy. Feed post-repair asset performance back into the ML model to confirm the fix restored output to the digital twin baseline. Refine alert threshold boundaries iteratively to minimize false positives.
- Specifics: Update asset health scores across the entire fleet weekly to guide capital expenditure planning.
- Success Checkpoint: False positive alert rates drop below 5% after the first 90 days of operation.
- Common Mistake: Technicians closing CMMS tickets without noting the exact cause of the fault, depriving the machine learning model of vital feedback needed for optimization.
What Are the Typical Costs and Financial Returns?
Implementing predictive maintenance requires upfront capital, but the operational savings generate a rapid payback period. Costs scale directly based on portfolio capacity, measured in Megawatts-peak (MWp).
| Expense / Metric | Typical Cost or Target Value | Operational Impact |
| SaaS Platform License | $150 to $350 per MWp annually | Grants access to the AI engine, digital twins, and dashboards. |
| Drone Thermography | $300 to $600 per MWp per flight | Identifies cell-level physical damage non-intrusively. |
| Hardware Retrofits | $1,200 to $3,500 per MWp | One-time setup fee for IoT gateways on legacy plants. |
| Setup & Integration Time | 4 to 8 weeks | Time required for data onboarding and ML model calibration. |
| ROI Payback Period | 14 to 22 months | The break-even point where O&M savings exceed software costs. |
How Does Predictive Maintenance Compare to Traditional Strategies?
Asset owners must evaluate PdM against legacy maintenance models to justify the software integration costs. The optimal strategy depends entirely on the size of the portfolio and the financial penalties attached to downtime.
| Strategy | Primary Mechanism | Pros | Cons |
| Reactive (Run-to-Fail) | Fix equipment only after a complete breakdown occurs. | Zero upfront software costs. No initial staff training required. | Severe operational downtime. Expensive emergency dispatch fees. |
| Preventative (Calendar) | Service components on fixed chronological schedules. | Simple to budget and schedule. Keeps components clean. | High labor waste on healthy assets. Misses intermittent faults. |
| Predictive (Data-Driven) | Intervene based on real-time AI degradation alerts. | Dispatches techs only when necessary. Catches failures early. | Requires initial software capital. Requires clean historical data. |
What Are the Common Pitfalls During Implementation?
Even with top-tier software, structural IT issues and operational habits can severely degrade the value of a predictive maintenance rollout.
The Data Silo Architecture Trap: SCADA data, local weather statistics, and historical field service tickets often sit in completely separate IT storage hubs. If the AI cannot access the weather data, it cannot calculate the digital twin baseline accurately. Deploy a centralized API middleware layer to push all data streams into a singular cloud data lake.
Alert Fatigue from Uncalibrated Thresholds: Overly sensitive AI models trigger dozens of low-priority warnings daily. Field technicians facing a barrage of minor voltage ripple alerts will quickly begin ignoring the system entirely. Implement a rolling multi-day confirmation window for minor anomalies before generating a field work order.
Overlooking Cloud-to-Edge Latency Drops: Poor cellular connectivity at rural solar fields drops telemetry data, leading to blind spots in the analytics engine. If the cloud loses connection with the plant for three hours during peak irradiance, the predictive model loses critical thermal data. Upgrade site communications to edge-computing gateways that log data locally during outages and upload packets automatically when connections stabilize.
Which Action Plan Fits Your Asset Tier?
The deployment of PdM technologies must match the scale of your assets. Over-deploying hardware on small sites destroys ROI, while under-deploying on utility sites leaves massive revenue exposed.
For Small-to-Medium C&I Asset Portfolios (1MW to 10MW)
Focus strictly on cloud-based inverter telemetry analytics using existing data streams. Avoid buying expensive new hardware combinations. Hook your existing inverter monitoring data directly into a third-party analytics platform via API. Schedule automated drone thermal flights once a year to catch panel degradation that string-level data might obscure.
For Large Utility-Scale Asset Developers (10MW to 100MW+)
Deploy a full-scale digital twin infrastructure paired with highly localized hardware diagnostics. Build automated pipelines connecting your SCADA systems directly to a dedicated machine learning platform. Embed automatic string-level I-V curve tracing across the entire installation. Establish contract Service Level Agreements (SLAs) with field crews tied directly to predictive alert deadlines to enforce the MTTR targets.
For Third-Party Solar O&M Providers
Use predictive health scoring as a premium service differentiator for your clients. Whitelabel a scalable PdM software dashboard to show your asset owners real-time performance and financial savings. Shift your field service technicians away from fixed calendar schedules, routing them dynamically based on automated machine alerts to maximize operational efficiency and profit margins.
Frequently Asked Questions
Does predictive maintenance void existing inverter warranties?
No. Passive data monitoring via APIs or non-intrusive edge gateways does not void hardware warranties. In fact, comprehensive PdM data logs often accelerate warranty claim approvals because you can provide the manufacturer with exact fault telemetry leading up to the failure.
How does soiling impact predictive analytics?
Heavy dust or snow can trick algorithms into diagnosing panel degradation. High-quality PdM platforms cross-reference string output with local weather data and localized soiling sensors to separate temporary environmental losses from true hardware faults.
Can legacy solar inverters connect to modern PdM platforms?
Yes, but they require translation. Legacy inverters using older serial connections require edge-computing gateways to convert local serial data into secure cloud-ready protocols like MQTT or HTTPS.
Is aerial thermography required if I have string-level monitoring?
String-level monitoring detects electrical output drops, but it cannot always identify the exact physical cause. Aerial thermography visually confirms physical defects like shattered glass, diode failures, and shading issues, making the two technologies complementary rather than redundant.
How does predictive maintenance affect solar insurance premiums?
Documented predictive maintenance protocols reduce equipment fire risks and catastrophic failure probabilities. Many commercial underwriters offer premium discounts to solar asset owners who can prove they use continuous digital twin monitoring to prevent thermal runaway events.