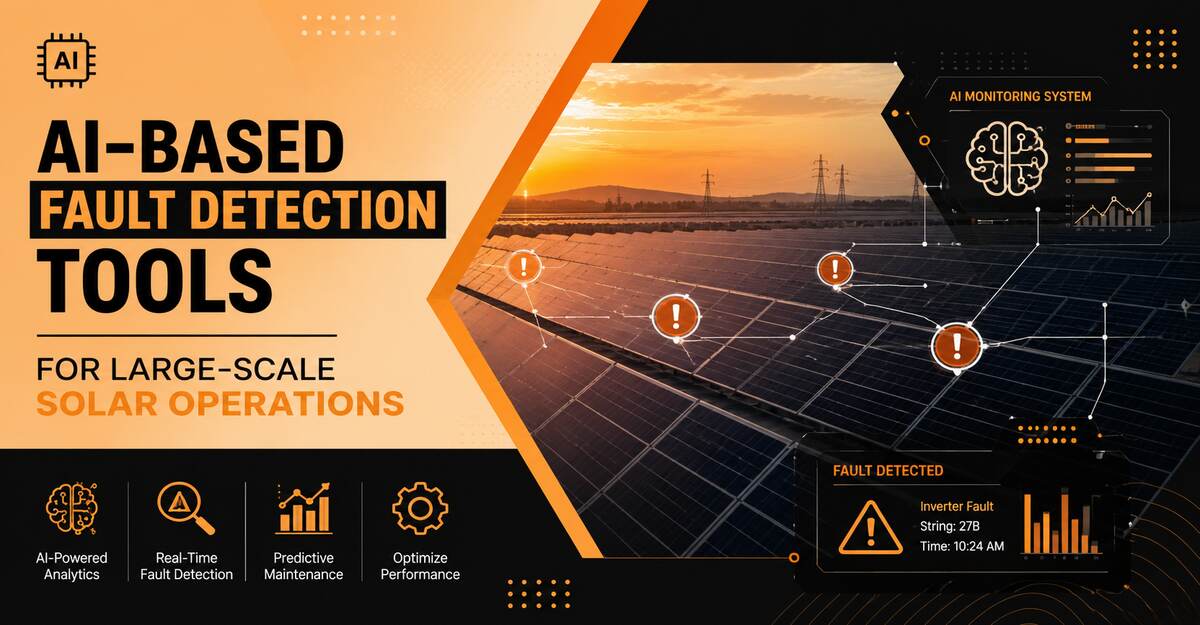
AI-based fault detection tools for large-scale solar operations are software systems that use machine learning, computer vision, and performance analytics to automatically find, classify, and geolocate faults across utility-scale photovoltaic plants. They replace manual string tests and visual walk-throughs, cutting a large share of avoidable revenue loss and moving O&M teams from reactive troubleshooting to scheduled, evidence-based repair.
Key Facts at a Glance
- These tools ingest two data classes: digital streams (SCADA, inverter logs, weather) and visual streams (drone, aircraft, or satellite infrared and RGB imagery).
- Localization accuracy on the best platforms exceeds 95% for pinpointing the exact string, tracker, or module row.
- SCADA-based analytics can flag underperformance within roughly 15 minutes; aerial surveys are periodic snapshots, usually run once or twice a year.
- Combined deployment typically recovers 1.5% to 5.0% of annual energy production that would otherwise be lost to undetected faults.
- Aerial thermal inspections cost about $2 to $5 per kW per year; SCADA analytics run about $0.80 to $2.20 per MW per month.
- Thermographic drone inspections are governed by the IEC 62446-3 standard, which sets the irradiance and weather conditions required for valid results.
What Are AI-Based Fault Detection Tools for Solar?
AI-based fault detection tools are automated diagnostic platforms that compare how a solar plant actually performs against how it should perform, then localize any gap to a physical asset. The central entity is fault detection, and its three attributes are detection (finding an anomaly), classification (naming the fault type), and localization (mapping it to a tracker, string, or module).
The category exists because utility-scale plants are too large to inspect by hand. A 100 MW site can hold 300,000 or more modules across hundreds of acres. A single blown fuse or a stuck tracker can bleed thousands of dollars per week and stay invisible on a monthly production report. AI tools close that blind spot by watching continuously and by reading thermal imagery faster and more consistently than a human technician.
The “up to 55% of revenue loss prevented” figure that circulates in industry marketing is a ceiling, not an average. It describes the share of underperformance losses that early, precise detection can recover on poorly monitored assets. On a plant that already has decent SCADA discipline, the realistic recoverable slice is smaller, which is why the annual-energy-recovery range of 1.5% to 5.0% is the number to plan budgets around.
How Do AI Fault Detection Tools Work?
AI fault detection tools work through a five-stage pipeline: ingest data, clean it, analyze against a baseline, localize the anomaly, then issue a work order. Each stage exists to convert raw signal into a specific field action.
Stage 1, data ingestion. The system continuously pulls real-time and historical parameters from the Supervisory Control and Data Acquisition (SCADA) network and from on-site meteorological stations, while thermal infrared and high-resolution RGB imagery are uploaded from drones, manned aircraft, or satellites on a schedule.
Stage 2, preprocessing. For digital data, the model repairs communication dropouts and filters sensor noise. For imagery, it removes cloud shadow, glare, and terrain distortion using orthorectification, which corrects the geometry of each image so a pixel maps to a true ground coordinate.
Stage 3, analysis. Two engines run in parallel. Convolutional Neural Networks (CNNs) read thermal pixels to spot hotspots, cracks, and delamination by shape and temperature signature. Regression and unsupervised models compare each string’s measured yield against a digital-twin baseline, which is a simulated model of expected output given the current irradiance and ambient temperature.
Stage 4, localization and classification. Detected anomalies are cross-referenced against the plant’s electrical map. The tool names the fault (diode failure, potential-induced degradation, soiling, tracker stall) and assigns it to a precise asset ID.
Stage 5, actionable alerting. The platform estimates the dollar cost of the specific power loss, attaches GPS coordinates, and pushes a work order into a Computerized Maintenance Management System (CMMS) so a crew is dispatched to the right row with the right spare part.
What Faults Can AI Detect in a Solar Plant?
AI tools detect faults across three layers: electrical, thermal, and environmental. Which faults a given tool sees depends entirely on its data source, and this is the single most misunderstood point in the market.
Electrical faults, caught by SCADA and string analytics, include string outages, blown fuses, inverter clipping, ground faults, tracker stalls, and slow degradation. Thermal and structural faults, caught by aerial imaging, include cell hotspots, bypass-diode failure, cracked or delaminated modules, junction-box overheating, and vegetation shading. Environmental faults, caught by satellite soiling platforms, include dust, snow, salt crust, and film deposition.
Two fault classes deserve special note. Potential-induced degradation (PID) is a slow voltage-driven power loss that string analytics catch as a trend and thermography confirms as a pattern of dim modules. Micro-cracks are invisible to SCADA entirely, which is why they only surface in aerial thermal or electroluminescence scans. No single modality sees everything, and any vendor claiming otherwise is overselling.
Main Types of AI Solar Fault Detection Systems
There are three primary system categories, and large operators run a combination rather than choosing one. The table below maps mechanism to fault coverage.
| System category | Mechanism | Faults detected | Representative tools |
|---|---|---|---|
| Aerial thermography (visual AI) | Drone, aircraft, or satellite IR imaging analyzed by CNNs | Diode failures, hotspots, cracks, delamination, shading, tracker misalignment | Raptor Maps, DroneDeploy, Sitemark, Aerospec |
| SCADA and string analytics | Continuous ML modeling of DC/AC current, voltage, power | String outages, blown fuses, clipping, degradation, tracker faults | AlsoEnergy PowerTrack, QOS Energy, SMA ennexOS, Inaccess |
| Satellite soiling platforms | ML comparison of atmospheric data to expected yield curves | Dust, snow, salt crusting, film deposition | Fracsun, Solcast, Vaisala 3TIER |
Two modalities the AI Overview omits are worth adding. Electroluminescence imaging captures internal cell defects invisible in daylight thermography and is used for warranty forensics, though it usually requires night operation or a dark tent. Module-level power electronics, where present, give per-module telemetry that closes the sub-string resolution gap SCADA cannot reach on its own.
Best AI Solar Fault Detection Tools by Use Case
The strongest platform depends on whether you own the asset, service it, or build it. Below are the leading tools mapped to the role each serves best, each with one honest drawback.
Raptor Maps, best for portfolio owners. Raptor Maps standardized aerial thermal reporting across large fleets and integrates fault data with financial impact per anomaly. Choose it if you manage many sites and need auditable, apples-to-apples inspection data to hold O&M providers accountable. Skip it if you have a single small site, where the per-inspection overhead is hard to justify. Drawback: it is inspection-centric, so you still need a live SCADA layer for continuous coverage.
AlsoEnergy PowerTrack, best for continuous performance monitoring. PowerTrack pairs 24/7 SCADA analytics with strong portfolio dashboards and revenue-grade metering. Choose it if you want always-on detection and financial reporting in one platform. Drawback: it cannot see sub-module structural damage, so it must be paired with periodic aerial imaging.
Fracsun, best for soiling-driven cleaning decisions. Fracsun replaces physical soiling sensors with modeled soiling ratios, simplifying cleaning economics across wide territories. Choose it in dusty or agricultural climates where cleaning timing drives yield. Drawback: macro models can miss hyper-local events like construction dust from an adjacent lot.
DroneDeploy and Sitemark, best for in-house drone programs. These platforms process your own flight imagery into fault maps, giving control over cadence and cost. Choose them if you fly regularly and want to keep data in-house. Drawback: output quality depends heavily on your flight discipline and adherence to irradiance standards.
Drone vs SCADA vs Satellite: Which Should You Use?
The direct verdict is that no single modality is sufficient, and the right mix depends on plant size, climate, and who runs O&M. Aerial thermography wins on structural resolution, SCADA wins on time coverage, and satellite wins on soiling economics.
On resolution, aerial thermography wins. Only imaging pinpoints a single hot cell or micro-crack, and only imaging produces the visual evidence needed for a manufacturer warranty claim. Its weakness is that it is a snapshot: it cannot see an intermittent night fault or a fuse that blows the week after the flight.
On time coverage, SCADA analytics wins. String analytics watch continuously and catch rapid faults like blown fuses or tracker blocks within minutes, using hardware you already own. Its weakness is resolution: string voltage alone cannot tell a bird-dropping-covered module from a degrading one.
On soiling economics, satellite wins. Satellite platforms remove the cost and maintenance of physical soiling sensors and optimize cleaning across a fleet. Their weakness is locality: they model regional atmosphere and can misread a site-specific dust event.
| Decision factor | Aerial thermography | SCADA analytics | Satellite soiling |
|---|---|---|---|
| Detection latency | Per flight (annual or biannual) | About 15 minutes | Daily to weekly |
| Spatial resolution | Module or cell level | String or inverter level | Site or region level |
| Best climate fit | All | All | Arid, dusty, agricultural |
| Continuous coverage | No | Yes | Partial |
| Warranty evidence | Strong | Weak | None |
The practical rule most operators land on: run SCADA analytics continuously as the backbone, add an annual or biannual aerial survey for structural detail, and layer satellite soiling only where cleaning costs are material.
Key Performance Numbers, Costs, and ROI
The headline numbers are a localization accuracy above 95%, a SCADA detection window near 15 minutes, and annual energy recovery of 1.5% to 5.0%. Those three figures drive every business case in this category.
Pricing bands. Drone aerial inspections run about $2 to $5 per kW per year, typically once or twice annually. SCADA analytics platforms run about $0.80 to $2.20 per MW per month, billed annually on capacity. Initial digital-twin setup is a one-time fee of roughly $500 to $2,500 per site depending on documentation quality.
A worked example. On a 100 MW plant, SCADA analytics at $1.50 per MW per month is about $180,000 per year, and an annual drone survey at $3 per kW adds about $300,000. If those tools recover even 2% of annual production on a plant generating 200,000 MWh at a $40/MWh PPA, that is roughly $160,000 recovered per year, before counting reduced truck rolls and faster warranty claims. Recovery closer to the 5% ceiling on a previously under-monitored asset changes the math dramatically.
Timeframes. Software onboarding takes 2 to 6 weeks to integrate SCADA APIs and build the digital twin. Drone image processing turns around in 48 hours to 7 days. Payback typically lands within 12 to 18 months, driven by recovered generation and reduced troubleshooting labor.
Common Implementation Mistakes and How to Fix Them
The most expensive mistakes are not technical failures but integration and data-hygiene failures. Three recur across nearly every deployment.
The data-silo blunder. Deploying an analytics platform that does not write into your CMMS forces technicians to hand-match PDF reports to physical rows, erasing the tool’s time savings. Fix: make bidirectional CMMS integration a hard requirement in procurement, not a later add-on.
The poisoned baseline. Training a digital twin on dirty historical SCADA means a chronically underperforming inverter teaches the model that its low output is normal, so real faults go unflagged. Fix: audit and correct historical data before baseline training, and re-baseline against as-built engineering drawings, not factory assumptions.
Ghost-alert fatigue. Thresholds set too tight without seasonal adjustment flood managers with non-actionable alerts on partly cloudy days, and teams start ignoring the system entirely. Fix: tune thresholds seasonally and rank alerts by dollar impact so crews chase the losses that matter.
Troubleshooting AI Fault Detection Failures
When results look wrong, the cause is almost always upstream data quality rather than the model itself. Two failure signatures cover most cases.
A high false-positive rate in drone reports usually means images were captured under low irradiance, below roughly 600 W/m², or under moving cloud that created false surface-temperature variation. The correction is to mandate that all flights meet IEC 62446-3 conditions: stable skies, minimal cloud, and high irradiance.
When SCADA AI misses string-level disconnections, the digital twin was likely built from corrupt PAN files or an inaccurate string map. The correction is to audit the software’s electrical model against the physical as-built drawings and re-map the affected strings.
An Honest Limitation: What These Tools Do Not Solve
AI fault detection tells you what is wrong and where, but it does not fix anything or eliminate field labor. It also cannot outrun bad inputs: a plant with no reliable string-level metering and poor as-built documentation will get weak results no matter how good the algorithm is. And a single aerial snapshot, however sharp, says nothing about the fault that appears next month. Treat these tools as a diagnostic layer that makes crews efficient, not as a replacement for a competent O&M program.
Which Tool Fits Your Role?
The right stack depends on your position in the asset’s lifecycle. Below are five personas, including two the standard guidance overlooks.
Independent power producers and asset managers. Prioritize portfolio-wide financial dashboards, such as Raptor Maps or AlsoEnergy, so you can track value erosion and hold O&M providers to account with clean data.
On-site O&M contractors. Prioritize deep CMMS integration that auto-generates work orders with GPS coordinates and spare-part lists, keeping technician wrench-time high.
EPC contractors at handover. Commission a high-resolution aerial survey immediately before plant acceptance to create an independent structural baseline that settles workmanship disputes before liability transfers.
Utility owner-operators. Favor platforms with strong SCADA-native integration and cybersecurity posture, since the tool sits inside critical infrastructure and must meet grid-operator data standards.
Lenders and independent engineers. Value auditable, standardized inspection data (IEC-compliant thermography) that can be trusted across portfolios for asset valuation and refinancing due diligence.
Frequently Asked Questions
What is a solar digital twin? A solar digital twin is a physics- and data-informed model of how a plant should perform under current irradiance and temperature. AI compares live output against this baseline, and any gap flags a potential fault. Its accuracy depends entirely on clean historical data and correct as-built electrical mapping.
How fast can AI detect a solar fault? SCADA-based analytics can flag underperformance within about 15 minutes of onset, versus days or weeks under manual review. Aerial thermography is periodic, so structural faults are only caught at each survey, typically once or twice a year.
Do I still need drones if I have SCADA analytics? Yes, for most utility-scale plants. SCADA sees electrical faults continuously but is blind to sub-module structural damage like micro-cracks and cell hotspots. Aerial thermography resolves those and produces the visual evidence needed for warranty claims, which string data cannot provide.
Can AI detect soiling on solar panels? Yes. Satellite soiling platforms model regional atmospheric conditions to estimate soiling loss and optimize cleaning schedules without physical sensors. Their limitation is that they can miss hyper-local events, so operators in dusty or agricultural sites often validate with periodic imagery.
What does IEC 62446-3 have to do with fault detection? IEC 62446-3 is the international standard governing thermographic inspection of PV plants. It defines the irradiance and weather conditions under which aerial thermal scans produce valid results, which is why disciplined operators require compliance to keep false positives low.
Is AI fault detection worth it for small solar plants? Often no for very small sites, where per-inspection overhead is hard to justify. The economics turn positive at utility scale, where a single undetected fault costs enough per week that the 1.5% to 5.0% recoverable energy easily covers the software and inspection spend.