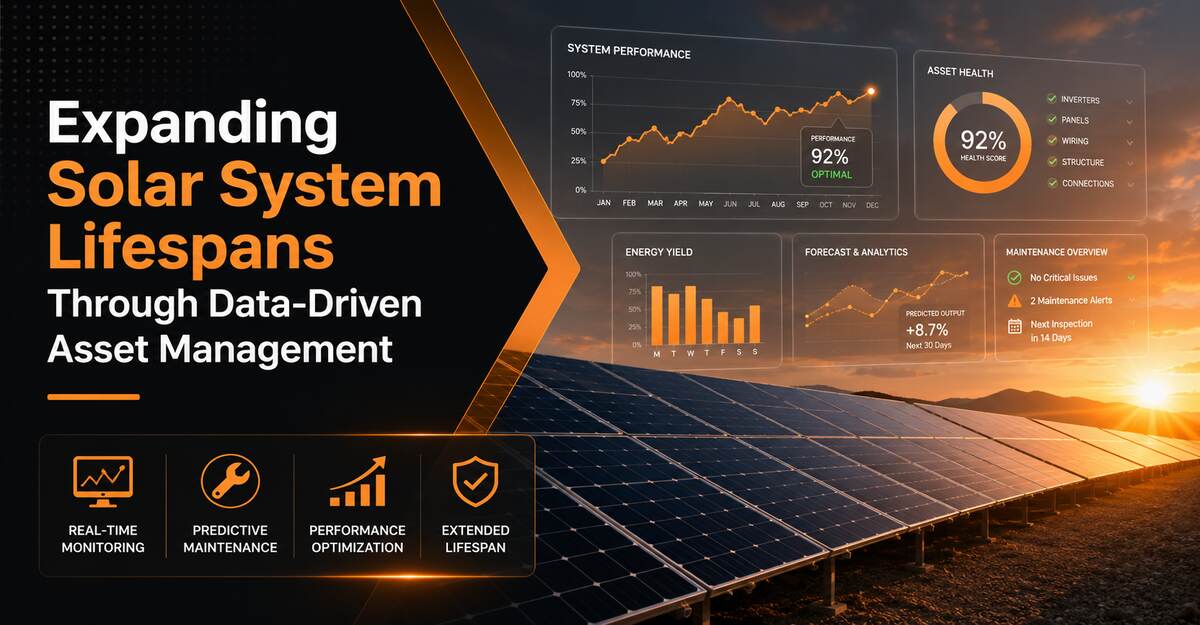
Data-driven asset management expands solar system lifespans by using continuous sensor data, predictive analytics, and electrical optimization to catch faults early, slow degradation, and defer failures. Operators who instrument their plants routinely push technical life from the standard 25 years toward 35 or more, while protecting energy yield and asset value across the whole term.
Key Facts at a Glance
- Data-driven asset management shifts maintenance from reactive (fix on failure) to condition-based (fix on evidence), which is the single biggest lever for solar longevity.
- Well-instrumented plants target availability above 98% and a performance ratio (PR) between 0.80 and 0.85; sustained shortfalls signal degradation worth investigating.
- NREL degradation studies place the median crystalline-silicon loss near 0.5% per year, with a fleet mean closer to 0.8% per year, meaning analytics exist mainly to find the fast-degrading outliers.
- Inverters, not modules, set the real replacement clock: most utility plants budget for one or two inverter swaps across a 30-year life.
- IEC 61724-1 is the international standard governing how solar monitoring data should be measured, classified, and reported.
- Soiling can cost 2% to 7% of annual yield, and in arid regions up to roughly 1% per day, so cleaning is a data-driven economic decision, not a routine.
What Is Data-Driven Asset Management for Solar Systems?
Data-driven asset management for solar is the practice of running a photovoltaic plant from continuous operational data rather than fixed schedules or manual inspection. It combines IoT sensors, inverter and meter telemetry, SCADA/DAS layers, and analytics software to monitor every string, decide when to intervene, and quantify the trade-off between an action’s cost and the energy or asset value it protects.
The discipline sits on top of three data layers. The measurement layer captures irradiance, module temperature, string current, inverter status, and revenue-grade export. The analytics layer compares actual output against a modeled expectation and flags deviations. The decision layer converts those flags into work orders, wash schedules, or capital plans. Asset management becomes “data-driven” only when the third layer closes: a dashboard that never triggers action is monitoring, not management.
How Does Data-Driven Asset Management Extend Solar Lifespan?
Data-driven asset management extends solar lifespan by detecting stressors early, before they compound into permanent damage. A micro-crack found by string-level analytics is a $0 fix if caught before it grows a hotspot; the same crack ignored can cook a junction box and take a module offline for good.
Real-Time Performance Monitoring
Real-time monitoring compares measured generation against a modeled benchmark derived from live irradiance and temperature, so any gap is attributable rather than mysterious. Sensors sampling at intervals defined under IEC 61724-1 expose anomalies such as dust accumulation, partial shading, or a failing bypass diode within hours instead of at the next quarterly site visit. The mechanism that protects lifespan is speed: a 3% yield gap caught this week is a cleaning ticket, while the same gap ignored for a season becomes irreversible cell degradation.
Predictive and Condition-Based Maintenance
Predictive maintenance uses trend analysis and periodic drone thermal imaging to intervene on condition, not on the calendar. Algorithms watch for rising series resistance, drifting inverter temperature, or a string trending below its neighbors, then schedule a targeted fix while the component is still recoverable. This reduces mechanical and thermal stress on healthy equipment and cuts operations cost, because a technician arrives with the right part and GPS coordinates instead of hunting the fault on site.
Inverter Health and Electrical Optimization
Inverter health assessment tracks conversion efficiency, internal temperature, fan status, and fault codes to replace parts before a total trip, and inverters deserve this attention because they are the plant’s most failure-prone major component. Firmware updates, capacitor replacement, and cooling maintenance are scheduled from performance metrics rather than after downtime. A practitioner rule holds here: modules usually outlive the warranty paperwork, so plan the plant’s long life around one to two inverter replacements, and the panels will generally still be producing.
How Long Do Solar Systems Actually Last?
Solar systems have three different “lifespans,” and conflating them causes bad decisions. Warranty life is a contractual promise, technical life is how long the hardware physically produces, and economic life is how long production is worth more than the cost to keep it running.
| Lifespan type | Typical figure | What it means |
|---|---|---|
| Product warranty | 12 to 25 years | Defect coverage on the module itself |
| Performance warranty | 25 to 30 years to ~80–87.5% output | Guaranteed floor for power output |
| Technical life | 30 to 40+ years | Physical production capability with maintenance |
| Economic life | 20 to 35+ years | Period where revenue exceeds operating cost |
Data-driven asset management primarily stretches economic life. It does this by lowering the operating cost per megawatt-hour (fewer truck rolls, less downtime) and by proving through logged data that the plant still performs, which is what unlocks the 35-plus-year plant life the industry now targets on well-run assets. The 35-year figure is realistic for utility-scale sites with quality bills of materials and disciplined data programs; it is optimistic for cheap residential arrays with no monitoring at all.
What Is a Normal Solar Degradation Rate?
A normal degradation rate for modern crystalline-silicon modules is roughly 0.5% per year at the median, based on NREL’s long-running field studies, though the fleet-wide mean sits closer to 0.8% because of underperforming outliers. Premium modules with strong PVEL scorecard results often hold below 0.4% per year, while some low-quality batches drift past 1%.
The value of analytics is not confirming the median; it is isolating the outliers. A plant losing an even 0.5% everywhere is behaving; a plant averaging 0.5% because half its strings hold 0.3% and a corner block loses 1.2% has a localized problem that data can find and money can fix.
What Causes Faster-Than-Normal Degradation?
Faster-than-normal degradation usually traces to a small set of named mechanisms, some reversible and some permanent. Distinguishing them is the whole point of instrumenting a plant, because the response differs completely.
- PID (Potential Induced Degradation): voltage stress drives ion migration; often reversible with PID-recovery devices applied at night.
- LID and LeTID: light- and temperature-induced degradation that appear in early operation; partly recoverable, partly permanent.
- Cell hotspots and micro-cracks: localized resistance heating; permanent once a cell scorches.
- Encapsulant browning and backsheet cracking: slow, permanent chemistry failures that no software can reverse.
Degradation also varies by technology. Thin-film CdTe and modern TOPCon and bifacial cells carry different first-year and long-term profiles than legacy multicrystalline modules, which is why a single “0.5%” assumption misleads across a mixed portfolio.
Which Metrics Define Solar Asset Health?
The metrics that define solar asset health are performance ratio, availability, specific yield, and degradation trend, and every serious monitoring platform reports them against a modeled expectation. A dashboard without these four is decoration.
| Metric | What it measures | Healthy range / signal |
|---|---|---|
| Performance Ratio (PR) | Actual vs theoretical output, weather-normalized | 0.80–0.85 for well-run plants |
| Availability | Time the plant was able to produce | Above 98%, often 99%+ target |
| Specific yield | kWh produced per kWp installed | Site-specific baseline; watch the trend |
| Degradation trend | Year-over-year output slope | Near 0.5%/yr; flag anything above ~0.8% |
| Soiling ratio | Output loss from surface fouling | 2–7%/yr typical; higher in dust belts |
A counterintuitive truth lives inside the soiling ratio: cleaning too often loses money. The correct trigger is the soiling breakeven, where the value of recovered power exceeds the cost of the wash cycle, not the mere sight of dust. Good software schedules a wash only when that inequality flips.
What Are the Core Data Strategies for Longevity?
The core longevity strategies convert raw telemetry into targeted, low-cost interventions. Each one exists because it protects yield or defers a failure that would otherwise shorten economic life.
| Strategy | Data source | Lifespan benefit |
|---|---|---|
| Soiling index management | Environmental and reference-cell sensors | Cleans only at economic breakeven, avoiding wasted water and downtime |
| Thermal anomaly detection | Aerial infrared thermography (drone) | Finds cell-level defects and dispatches technicians with exact GPS coordinates |
| String-level analytics | Per-string current and voltage | Isolates faulty bypass diodes and loose wiring before resistance overheats neighbors |
| Degradation isolation | Long-term yield trending | Separates uniform aging from fixable localized loss |
A common practitioner mistake is buying module-level monitoring across the entire plant. String-level telemetry combined with an annual drone IR scan catches the large majority of recoverable yield loss for a fraction of the hardware cost, and module-level sensors are best reserved for high-value or chronically problematic blocks.
What Software Architecture Supports This?
The supporting architecture moves data from the field to a decision in four layers, and interoperability across brands is what makes it usable at portfolio scale. A modern platform ingests mixed inverter, weather-station, and revenue-meter data into one dashboard rather than forcing separate tools per vendor.
- Edge processing: inverter gateways handle high-frequency electrical data locally and compress it before upload, minimizing cellular data cost and latency.
- CMMS integration: performance alerts feed a Computerized Maintenance Management System that auto-generates work orders with required parts and safety protocols. Alerts that do not become tickets get ignored within weeks, so this link is not optional.
- Digital twin modeling: a cloud replica simulates weather extremes and aging to test structural and electrical thresholds without risking the real plant.
- API interoperability: open APIs unify multi-brand hardware, which matters because most portfolios accumulate several inverter generations over a decade.
The honest caveat on this stack is data quality. A miscalibrated irradiance sensor or a drifting meter feeds every layer above it with error, so a digital twin is only as trustworthy as its worst input.
What Are the Financial Benefits of Data-Driven Solar Management?
The financial return on data-driven asset management shows up in four line items, each backed by the operational record the monitoring itself produces. The through-line is that verifiable data lowers perceived risk, and lower risk has a dollar value.
| Financial lever | Mechanism | Effect |
|---|---|---|
| Lower insurance premiums | Continuous insulation and arc-fault monitoring | Insurers reprice a lower risk profile |
| Higher salvage value | Clean, documented operational logs | Raises secondary-market plant valuation |
| Extended PPA timelines | Data-backed proof of remaining life | Enables renegotiation past the standard 20-year mark |
| Optimized capex reserves | Accurate inverter degradation curves | Delays replacement-fund outlays and improves cash flow |
The follow-on flow is straightforward: real-time field data feeds predictive analytics, which drives targeted component fixes, which sustains a 35-plus-year producing asset. Each stage is only credible because the stage before it is measured, not assumed.
When Is Data-Driven Asset Management Not Enough?
Data-driven asset management is not a cure for hardware that is fundamentally failing, and pretending otherwise wastes money. Monitoring can schedule and target interventions, but it cannot reverse encapsulant browning, cell corrosion, backsheet cracking, or a bad module bill of materials. When a batch degrades because of manufacturing chemistry, the only real fix is replacement, and the data’s job shrinks to telling you which modules and when.
The discipline also carries real cost and real false positives. Sensors, connectivity, and analytics licenses add operating expense, and immature alert thresholds generate noise that fatigues technicians until they stop trusting the system. On very small residential systems, the cost of comprehensive instrumentation can exceed the yield it protects, which is why granular monitoring is a utility-scale and commercial economic case first, and a residential one only selectively.
Life Extension or Repowering: Which Path Fits?
The choice between life extension and repowering turns on where the value is bleeding. If the modules still perform near their degradation curve and inverters are the constraint, data-driven life extension (targeted swaps, firmware, cleaning) is almost always cheaper. If the modules themselves have degraded past economic sense, repowering with modern, higher-efficiency panels on the existing land, interconnection, and grid rights is the stronger play.
| Factor | Favors life extension | Favors repowering |
|---|---|---|
| Module health | Near-normal degradation | Widespread permanent loss |
| Inverter status | Serviceable, 1–2 swaps left | End of support, no parts |
| Interconnection value | Adequate for current output | Underused capacity worth refilling |
| Capital availability | Limited | Available and returns-justified |
Increasingly this decision includes co-located battery storage. A plant with strong grid rights and good data history is a prime candidate to add a BESS during repowering, and the same asset-management platform that extended its solar life typically manages the battery’s health too.
Frequently Asked Questions
Can data-driven management really push a solar plant to 35 years? Yes, on quality utility-scale hardware with disciplined monitoring. The 35-plus-year figure reflects technical life supported by condition-based maintenance and documented performance. It is realistic where module bills of materials are sound and inverters are maintained, and unrealistic for cheap, unmonitored arrays.
What is IEC 61724 and why does it matter? IEC 61724-1 is the international standard defining how photovoltaic monitoring systems measure, classify, and report performance data. It matters because it makes performance ratio and availability figures comparable across plants and vendors, which is what lets investors and insurers trust the numbers.
Which solar component fails most often? Inverters are the most failure-prone major component in most plants, driving a disproportionate share of downtime relative to their count. Modules typically outlast their warranties, so replacement planning across a 30-year life centers on one to two inverter swaps, not panel replacement.
How much does solar monitoring cost? Costs vary by scale and granularity, but monitoring and analytics are typically a modest slice of total operations spend, which itself runs in the range of a few dollars to low double digits per kilowatt per year for utility plants. Granular module-level hardware raises that; string-level plus periodic drone scans keeps it lean.
What is a performance ratio in solar? Performance ratio (PR) is the weather-normalized comparison of a plant’s actual output to its theoretical output. A well-run plant sustains a PR between 0.80 and 0.85. A falling PR that is not explained by weather is the clearest early signal that degradation or a fault needs investigation.
Does monitoring actually lower insurance premiums? It can, because continuous insulation monitoring and arc-fault detection reduce fire and failure risk, and insurers price that lower risk profile. The documented operational record also speeds claims and due diligence, which is part of why well-logged portfolios carry higher secondary-market value.
The Bottom Line
Expanding solar system lifespans through data-driven asset management works because it replaces guesswork with evidence: it finds the fast-degrading outliers, fixes them while they are still cheap to fix, and proves the plant’s remaining value in numbers that insurers, buyers, and PPA counterparties will pay for. It cannot save fundamentally bad hardware, and it adds cost and noise if implemented carelessly. Deployed with discipline, though, it is the most reliable path from a standard 25-year design life toward 35 producing years and beyond.