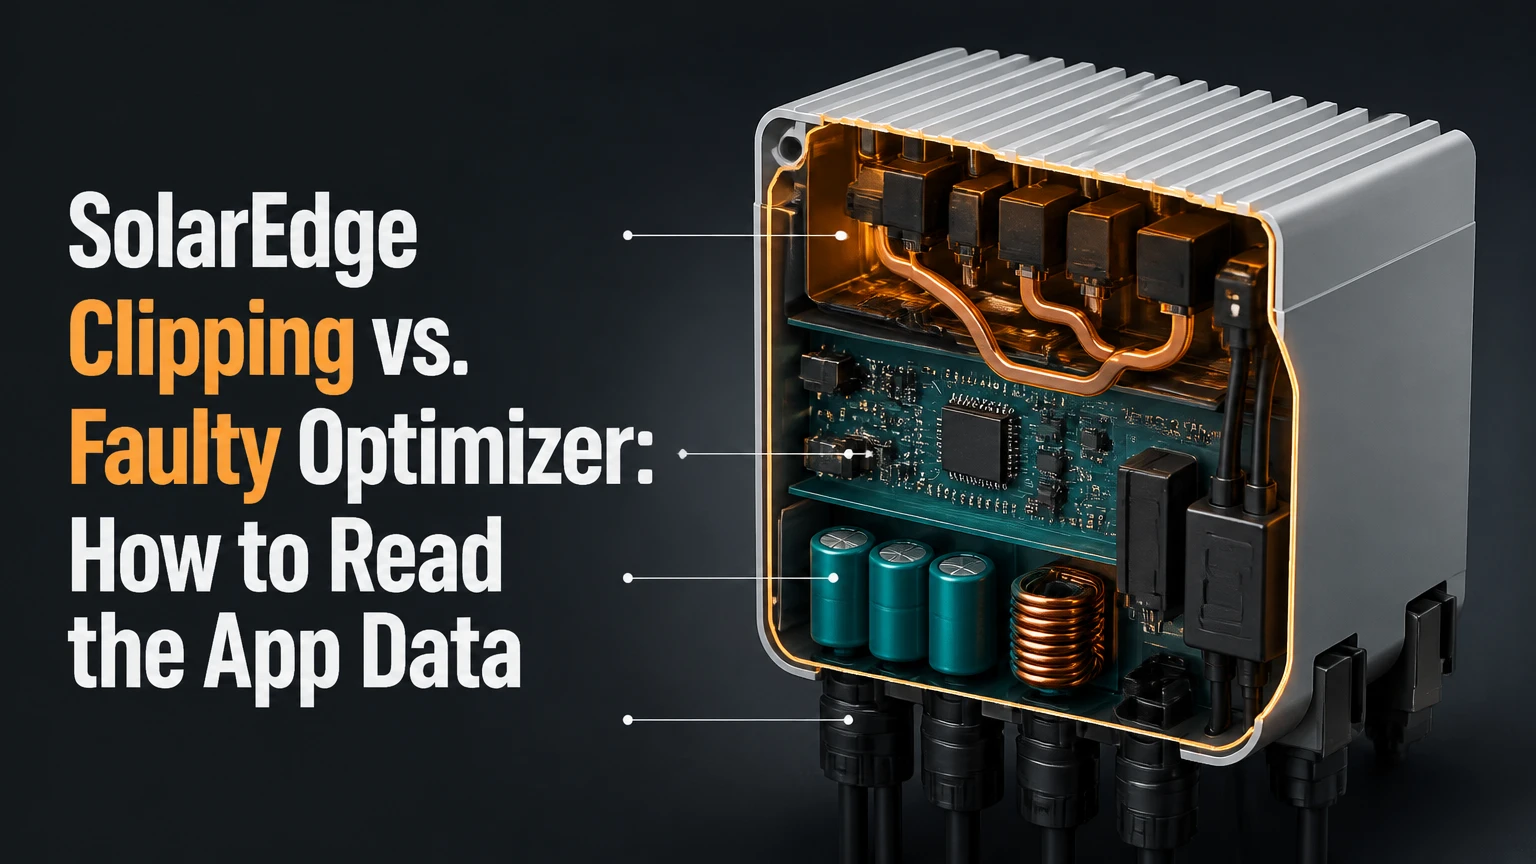
SolarEdge clipping is a normal system-level AC limit, while a faulty optimizer is a module-level electrical or communication problem. A smooth plateau at the inverter’s rated AC output points toward clipping; one persistently abnormal module, especially with a fault status and matching production loss, points toward an optimizer or wiring issue.
Key Facts at a Glance
Inverter clipping limits total AC output near the inverter’s configured export or continuous-power limit.
A faulty SolarEdge optimizer usually appears as one or more modules with persistent low production, missing telemetry, or a recorded fault.
A flat-topped curve is evidence of clipping only when its level matches the applicable AC limit and conditions are otherwise normal.
SolarEdge module voltage readings are diagnostic clues, not universal pass-fail thresholds; a reported 1 V value does not independently prove hardware failure.
Cloud movement, shade, soiling, snow, grid curtailment, and inverter temperature can all reduce output without damaging an optimizer.
App screenshots become much more useful when they include the date, weather conditions, inverter model, array size, and affected module identifiers.
What Is the Fastest Reliable Distinction?
The fastest reliable distinction is scope: clipping affects the whole inverter output, while an optimizer fault usually affects one module or a small, identifiable group. Compare a clear-day system power curve with the inverter’s applicable AC limit, then inspect individual modules on the same date and time.
A system can show both conditions at once. For example, a 10.2 kW DC array on a 7.6 kW AC inverter may clip around midday while one optimizer separately reports low module output. The plateau explains the system ceiling, but it does not explain an isolated module anomaly.
SolarEdge’s monitoring architecture separates system production from module-level telemetry. That separation makes the logical layout useful for total-power behavior and the physical layout useful for localization. Neither screen, by itself, proves a component has failed.
| Diagnostic evidence | More consistent with clipping | More consistent with optimizer trouble |
|---|---|---|
| System power curve | Smooth ceiling near 7.6 kW | Depressed or irregular curve |
| Module pattern | Most modules reach expected output | One module remains low |
| Timing | Mostly near high irradiance | Persists across sunny periods |
| App status | No related fault event | Repeated fault or missing telemetry |
| Recovery pattern | Output falls normally after peak | Affected module remains abnormal |
| Best next check | Compare AC limit and array size | Compare neighboring modules and event history |
How Does Normal SolarEdge Clipping Appear?
Normal clipping appears as a broad, smooth production curve that reaches a repeatable ceiling during periods when available DC power exceeds the inverter’s AC conversion or export limit. The ceiling may be rounded in app data because of sampling intervals, cloud movement, temperature, or chart resolution.
Clipping is not a panel defect. The photovoltaic array can produce more DC power than the inverter can deliver as AC at that moment, so the inverter controls the operating point and limits conversion. The unused potential is curtailed rather than delivered to the home or grid.
A typical residential design may use a DC-to-AC ratio of approximately 1.2-1.5, but the appropriate ratio depends on climate, roof orientation, tilt, utility rules, inverter limits, and the designer’s financial model. NREL’s PVWatts documentation treats system losses and inverter behavior as design inputs rather than assuming every array operates at its nameplate maximum every hour.
How Much Energy Does Clipping Cost?
Clipping losses are usually concentrated around a limited number of high-irradiance hours, not spread evenly across the day. A 10 kW DC array paired with a 7.6 kW AC inverter does not lose 24% of daily energy simply because 10 divided by 7.6 equals 1.32.
| Array and inverter example | DC-to-AC ratio | Likely clipping window | Interpretation |
|---|---|---|---|
| 6.0 kW DC, 6.0 kW AC | 1.00 | 0-20 minutes | Little deliberate oversizing |
| 8.0 kW DC, 6.0 kW AC | 1.33 | 1-3 hours on strong days | Common residential oversizing pattern |
| 10.0 kW DC, 7.6 kW AC | 1.32 | 1-4 hours by season | Confirm against orientation and export settings |
| 12.0 kW DC, 7.6 kW AC | 1.58 | Several peak hours | Higher clipping exposure |
| 8.0 kW DC, 8.0 kW AC | 1.00 | Usually negligible | A low curve needs another explanation |
The correct comparison is annual energy and financial yield, not the highest instantaneous wattage. A larger inverter may reduce clipping but can add equipment cost, require electrical redesign, and operate below its ideal loading range more often.
What Does a Faulty Optimizer Look Like?
A faulty SolarEdge optimizer typically creates a persistent module-level anomaly, such as unusually low power, absent telemetry, a recorded optimizer communication fault, or a module that fails to track its neighbors under similar irradiance. The strongest evidence is repeated behavior across multiple clear periods.
A low module reading is not automatically a failed optimizer. The panel may be shaded, dirty, snow-covered, incorrectly mapped, disconnected, mismatched with its neighbors, or oriented on a different roof plane. A loose connector or damaged cable can produce symptoms that resemble optimizer failure.
SolarEdge power optimizers have model-specific operating ranges and safety functions. The monitoring portal’s voltage field may represent a measured, estimated, or state-dependent value, and the meaning of a particular low number depends on the optimizer model and firmware. SolarEdge installation documentation should control interpretation.
Is the One-Volt Rule Definitive?
The one-volt rule is not definitive. A displayed 1 V value can be a meaningful fault clue in some SolarEdge diagnostic contexts, but it is not a universal failure threshold for every optimizer, inverter generation, firmware version, or monitoring state.
Treat 1 V as a prompt for corroboration. Check whether the same module also has missing power, a persistent alert, abnormal status, and a large output gap compared with modules exposed to similar sunlight. A single screenshot without time, weather, and neighboring values cannot establish a hardware diagnosis.
| Layout observation | Possible meaning | Confirmation required |
|---|---|---|
| 0-1 V with no telemetry | Safe state, communication loss, or reporting artifact | Event log and model-specific manual |
| 2-10 W while neighbors produce 250 W | Shading, connector issue, optimizer, or panel problem | Clear-day comparison and physical inspection |
| Normal voltage, low energy | Orientation, shade, soiling, or panel mismatch | Irradiance and roof-plane comparison |
| Grey module overnight | Normal unavailable data | Daylight screenshot |
| Several adjacent modules offline | String, communication, or inverter issue | String topology and installer diagnostics |
| One module intermittently missing | Connector, cable, thermal, or communication issue | Repeated time-series data |
How Do You Compare the Chart With the Inverter?
Compare the highest sustained AC value with the inverter’s rated continuous output and any site-level export limit, not merely with the product name. A SolarEdge SE7600H-US, for example, is associated with a 7.6 kW AC class, but the installed configuration, grid profile, and export-control settings still matter.
Read the exact inverter model from the equipment label or monitoring portal. Then check the applicable SolarEdge datasheet, commissioning record, and utility configuration. The chart may report power in watts, kilowatts, or a rounded interval value, so a displayed 7.5 kW or 7.6 kW plateau may represent the same practical ceiling.
| Item to verify | Example value | Why it matters |
|---|---|---|
| Inverter model | SE7600H-US | Determines equipment-specific AC capability |
| Nameplate AC output | 7.6 kW class | Provides the comparison ceiling |
| Array DC nameplate | 10.0 kW | Establishes oversizing potential |
| Observed plateau | 7.55-7.65 kW | Supports clipping when sustained |
| Export limit | 5.0 kW | Can create a lower system ceiling |
| Chart interval | 5 or 15 minutes | Can flatten or hide short events |
A plateau below the inverter’s nameplate does not automatically identify a fault. Export control, grid voltage, utility settings, inverter temperature, reactive-power requirements, and site consumption rules can all limit AC delivery.
What Does a Fault Curve Look Like?
A faulty-optimizer pattern usually looks like a normal irradiance-driven curve with an unexplained reduction in total output, rather than a clean ceiling at a fixed AC value. The system curve may still be smooth when one module underperforms, especially on a large array.
The physical layout is more informative than the total curve in this situation. Compare modules on the same roof plane, with similar tilt and azimuth, during the same 15-minute interval. A module that is consistently 30-50% below comparable neighbors deserves investigation, while a west-facing module should not be compared directly with a south-facing module at noon.
How Should You Read the Physical Layout?
Use the physical layout to identify location, timing, and persistence. Open the module view for power and energy first, then review voltage, status, and alerts where the portal makes those fields available for the installed equipment.
The physical map must be accurate. A module shown in the wrong roof position can send an installer to the wrong panel, and an unmapped optimizer can make a real fault appear impossible to locate. Layout accuracy is therefore part of the diagnostic evidence, not an administrative detail.
A Practical Module Comparison
Choose at least three comparison modules with similar orientation and exposure. Record values at the same timestamp on a clear day, then repeat on another day rather than diagnosing from one transient reading.
| Module situation | Example affected value | Neighbor values | Initial interpretation |
|---|---|---|---|
| Equal exposure, strong sun | 35 W | 250-320 W | Significant anomaly |
| Partial tree shade | 80 W | 260-310 W | Shade may explain loss |
| East-facing array at 2 p.m. | 120 W | 100-150 W | Probably normal orientation |
| Snow-covered module | 0 W | 240 W | Environmental obstruction |
| All modules low | 180 W | 175-190 W | Weather or system-level limit |
| One module offline all day | No value | 250-300 W | Communication or hardware investigation |
Module power is often a stronger first comparison than voltage. Voltage can vary with operating state and optimizer behavior, while repeated power loss under comparable light directly shows the production consequence.
Which Conditions Mimic an Optimizer Failure?
Shade, soiling, snow, mixed roof orientations, incorrect layout mapping, export curtailment, and communications outages can mimic an optimizer failure. The distinguishing factor is whether the anomaly follows sunlight and physical conditions or persists after those conditions change.
Cloud edges can create sharp changes across modules without any hardware failure. Seasonal shade can affect one row at the same time each day. East-west arrays can produce a broad, low midday curve that is sometimes mistaken for clipping even though the array is simply distributing production across different solar angles.
| Look-alike condition | Typical app signature | Useful test |
|---|---|---|
| Moving cloud | Several modules change together within minutes | Compare cloud movement and adjacent modules |
| Fixed shade | Same module or row drops at repeatable times | Compare shade calendar and roof geometry |
| Soiling | Gradual low output across exposed modules | Visual inspection and post-cleaning comparison |
| East-west orientation | Different module groups peak at different hours | Compare morning and afternoon groups |
| Export curtailment | System ceiling below inverter rating | Review site-control and utility settings |
| Communication outage | Many modules lose telemetry together | Check inverter and portal event history |
| High temperature | Output falls after heating, often system-wide | Compare ambient conditions and inverter alerts |
| Incorrect map | Data appears attached to wrong panel | Verify as-built layout with installer |
When Is the Problem Communications Rather Than Hardware?
A communications problem is more likely when many optimizers disappear together, the inverter remains online but module data stops updating, or the portal shows stale timestamps across a string or site. A single missing module with normal neighbors is more suspicious for a local connector, optimizer, or panel issue.
Monitoring data has two separate dependencies: energy conversion and data communication. A module can continue contributing to string operation while its telemetry is unavailable, or it can stop contributing and also disappear from monitoring. The app alone may not distinguish those states without inverter event records.
Do not repeatedly power-cycle equipment as a diagnostic shortcut. SolarEdge manuals and installer procedures specify shutdown and startup sequences, and electrical work near photovoltaic DC wiring can remain hazardous even when the inverter is off. If an installer asks for a reset, follow the exact model procedure and never open the inverter or disconnect roof-level connectors yourself.
What Should You Do After Finding an Anomaly?
Document the evidence before changing settings. Save the system chart, affected module view, inverter model, alert details, timestamps, and weather conditions, then send the package to the installer or SolarEdge support channel.
Use this sequence:
- Select two clear days with comparable weather.
- Capture the system power curve from sunrise through late afternoon.
- Record the highest sustained AC value and its duration.
- Open the physical layout and identify modules with low or missing data.
- Compare each affected module with three physically similar neighbors.
- Export or photograph alert and event messages, including their codes.
- Check whether the portal timestamp is current.
- Contact the installer with the complete evidence set.
The installer may then check connectors, string voltage, optimizer pairing, inverter event logs, insulation resistance, module condition, and the physical layout. Roof access and energized DC circuits make this a service task rather than a homeowner repair.
What Evidence Should You Export?
A useful service ticket contains enough context to separate a design limit from a component fault. “Panel is low” is insufficient because it omits the comparison conditions that make the observation meaningful.
| Evidence item | Example | Diagnostic value |
|---|---|---|
| Date and local time | 2025-06-18, 12:45 p.m. | Aligns readings and solar position |
| Weather | Clear, 28°C, no snow | Reduces environmental ambiguity |
| System peak | 7.58 kW for 90 minutes | Tests AC-limit hypothesis |
| Affected module | Row 3, panel 5, 42 W | Identifies scope and location |
| Neighbor readings | 275 W, 289 W, 301 W | Establishes a fair comparison |
| Event text | Optimizer communication warning | Connects telemetry to hardware clues |
| Inverter model | SE7600H-US | Identifies relevant specifications |
What Do Repair Costs and Timelines Look Like?
A warranted optimizer may have no hardware charge, but labor, travel, diagnostic time, and installer warranty terms determine the homeowner’s final bill. A typical out-of-warranty service visit may cost approximately $150-$400 for labor, with difficult access, steep roofs, permits, and regional rates increasing the total.
SolarEdge states that many power optimizers carry a 25-year product warranty, while inverter warranty duration varies by product and warranty package. The product warranty does not automatically guarantee free labor or immediate replacement, so the installer contract must be checked separately.
| Repair component | Typical range or term | Variable that changes it |
|---|---|---|
| Optimizer product warranty | Up to 25 years for eligible units | Model, registration, and warranty terms |
| Standard inverter warranty | Often 12 years | Product family and purchased extension |
| Labor service visit | $150-$400 typical | Region, roof access, and installer policy |
| Diagnostic appointment | 1-3 hours typical | Number of affected devices |
| Replacement scheduling | 1-4 weeks typical | RMA stock and installer workload |
| Roof-level replacement | 1-3 hours typical | Array design and access conditions |
These figures are practitioner ranges, not guaranteed prices. Request a written quote that separates replacement hardware, diagnostic labor, roof access, shipping, permit work, and warranty administration.
Should You Upsize the Inverter?
Upsizing the inverter is usually unnecessary when clipping matches the original system design and annual energy remains close to the production model. Consider redesign only when clipping is materially higher than expected, the array has been expanded, export rules changed, or the inverter has an unrelated capacity problem.
A larger inverter cannot repair a failed optimizer. It also cannot restore energy lost to shade, soiling, a disconnected module, or an inaccurate layout. The correct decision requires annual clipping estimates, inverter replacement cost, remaining equipment life, utility approval, and the value of recovered kilowatt-hours.
Quick Decision Rules
- Choose “normal clipping” when the curve reaches a repeatable ceiling near the configured AC or export limit and module readings remain coherent.
- Choose “optimizer investigation” when one comparable module remains materially low across clear-day tests.
- Choose “communications investigation” when many modules lose telemetry at the same time.
- Choose “environmental investigation” when the anomaly follows shade, snow, dirt, or a roof-plane difference.
- Choose “installer diagnosis” when voltage and status fields conflict or event codes recur.
What Are the Most Common Diagnostic Mistakes?
The most common diagnostic mistake is treating one app color or one voltage number as a complete diagnosis. SolarEdge monitoring data is strongest when multiple independent signals agree: system shape, module comparison, event history, physical conditions, and inverter configuration.
Three practitioner rules prevent many unnecessary service calls:
- Never compare unlike roof planes. An east-facing module at noon may underproduce relative to a south-facing module while operating normally.
- Use persistence as a filter. A fault that appears for one five-minute interval is weaker evidence than the same module underperforming on two clear days.
- Separate power from energy. Low instantaneous watts can be normal at a particular solar angle, while a full-day kilowatt-hour deficit is a different measurement.
Another counterintuitive point is that a clean plateau can coexist with a bad optimizer. The plateau identifies a whole-inverter limit, not the health of every module underneath it.
FAQ
Can a bad solar panel cause the same app pattern as a faulty optimizer?
Yes. A damaged photovoltaic module, connector, cable, or optimizer can produce similar low-output data. SolarEdge monitoring localizes the symptom to a module position, but an installer must test the hardware to identify the failed component. Persistent low power with normal exposure is evidence of a module-level problem, not proof of a specific part.
Why does my SolarEdge system produce less power than the panel labels?
Panel labels state DC nameplate power under laboratory conditions, while the inverter reports converted AC power after temperature, irradiance, wiring, inverter, orientation, shading, and export limits affect production. A 10 kW array will not deliver 10 kW AC continuously, particularly when paired with a smaller inverter.
Does clipping happen only in summer?
No. Clipping can occur whenever irradiance and module operating conditions provide more DC power than the inverter or export setting allows. Clear winter days can clip in a well-oriented array, although seasonal sun angle, temperature, snow, and day length change the frequency and duration.
Why are optimizer voltages different from panel voltages?
A SolarEdge optimizer regulates electrical operating conditions between the module and inverter string. Its reported voltage may therefore differ from a simple panel open-circuit or operating-voltage expectation, and the value changes with load, irradiance, optimizer state, and model. Use the installed model’s documentation rather than a universal voltage rule.
Can the SolarEdge app prove that an optimizer has failed?
The app can provide strong evidence and identify the affected location, but it usually cannot replace electrical testing. A fault alert, missing telemetry, and repeated low production make a service diagnosis efficient; the installer still needs to verify connectors, wiring, module output, optimizer behavior, and safe operating conditions.
The Bottom Line
SolarEdge Clipping vs. Faulty Optimizer: How to Read the App Data becomes straightforward when diagnosis proceeds from system scope to module scope. A repeatable plateau near the configured inverter or export limit is normal clipping; a persistent outlier module with corroborating status or event evidence deserves optimizer and wiring investigation.
Do not rely on the flat curve, a grey icon, or a 1 V reading alone. Compare clear-day charts, physically similar modules, timestamps, inverter specifications, and event history, then give the installer a documented evidence package instead of attempting roof-level electrical work.