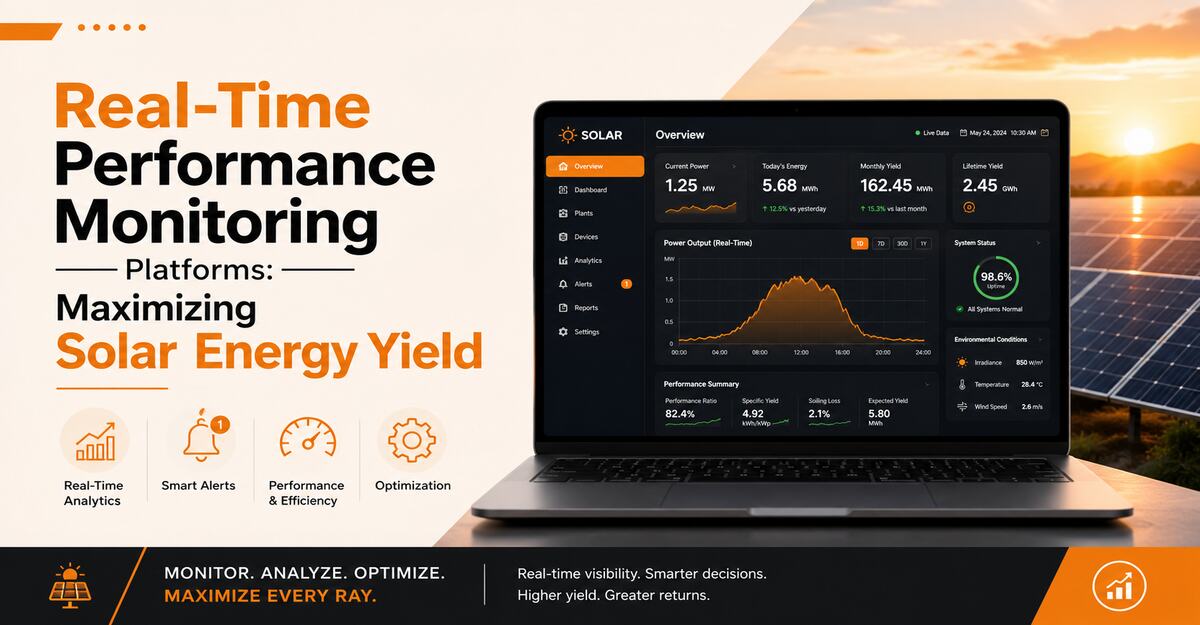
Real-time performance monitoring platforms continuously collect and correlate module, inverter, electrical, and environmental telemetry to detect production losses before they become prolonged energy shortfalls. The strongest platforms improve solar yield by shortening detection time, identifying affected equipment, prioritizing revenue impact, and giving operations teams the evidence required to restore output quickly.
Key Facts at a Glance
- Real-time monitoring converts plant telemetry into alerts, dashboards, performance analytics, and maintenance evidence.
- Production metrics show what changed, event logs explain recorded faults, and device-level drill-down reveals where energy was lost across the array.
- The four essential solar signals are production, irradiance, faults, and equipment stress.
- High availability depends on actionable alerts, clear ownership, tested response procedures, and resilient plant design.
- Collecting more telemetry does not automatically improve yield because noisy or unbounded data can hide important signals.
- Monitoring should measure expected-versus-actual energy performance, not only whether inverters are switched on.
What Is Real-Time Solar Performance Monitoring?
Real-time solar performance monitoring is the continuous collection, processing, and evaluation of telemetry generated by PV modules, strings, combiner boxes, inverters, transformers, trackers, meters, weather stations, and grid interconnection points. A monitoring platform turns that telemetry into operational evidence that helps teams identify abnormal behavior, understand its effect on energy production, and respond before a fault expands into lost revenue.
Communication standards such as SunSpec Modbus, IEC 61850, and MQTT define how devices expose measurable signals. A vendor-neutral framework supports the acquisition, generation, collection, and export of production data, event logs, and device status.
A complete platform commonly includes:
- Data loggers, RTUs, or device-level agents
- Inverter and meter integrations
- Time-series production storage
- Event and alarm log indexing
- Device-level and string-level drill-down
- Plant and portfolio topology maps
- On-site sensor and satellite irradiance monitoring
- Dashboards and performance scorecards
- Alarm evaluation and notification routing
- Fault investigation and work-order workflows
- Data retention, access, and governance controls
Monitoring is not merely a wall of production graphs. A useful platform connects electrical behavior to plant health, energy revenue, contractual performance guarantees, and operational responsibility.
How Do Monitoring Platforms Improve Solar Yield?
Real-time performance monitoring platforms improve yield by reducing the duration and reach of production losses. They identify abnormal conditions earlier, show which equipment and circuits are affected, and provide responders with correlated evidence that reduces diagnostic guesswork.
Monitoring does not prevent every failure. Inverters can trip, modules can degrade, connectors can corrode, trackers can seize, and grid operators can curtail export. Monitoring improves the probability that teams will notice, understand, contain, and recover from those losses quickly.
The operational chain is:
- Detect the abnormal condition.
- Confirm whether energy production is affected.
- Identify the failing device or circuit.
- Determine the likely cause.
- Dispatch a safe corrective action.
- Verify that production has recovered.
- Record the event and prevent recurrence.
A platform that detects an issue in one minute but provides no diagnostic context may still produce days of lost generation before a technician is dispatched. A platform that detects the same issue in fifteen minutes but immediately identifies the affected inverter, string, and expected energy loss may support far faster recovery.
Yield Is More Than Inverter Availability
An inverter can report “online” while the plant still underperforms. A PV array may show inverters running normally while individual strings are open-circuited, modules are soiled, trackers are stuck, or output is silently clipping below the expected level.
Reliability concerns whether a plant performs as its design and irradiance conditions predict, not simply whether equipment is technically energized.
Effective yield monitoring therefore evaluates:
- Actual versus expected energy production
- Performance ratio
- Specific yield (kWh/kWp)
- Inverter and string availability
- Soiling and shading losses
- Irradiance and module temperature
- Grid export capacity and curtailment
- Data integrity of returned measurements
How Does a Real-Time Solar Monitoring Platform Work?
A real-time monitoring platform normally operates through six connected stages: instrumentation, collection, enrichment, ingestion, analysis, and response.
1. Instrumentation Generates Telemetry
Plant equipment must first expose measurable signals. Instrumentation may come from inverter Modbus registers, revenue-grade meters, string-level combiner monitoring, module-level power electronics, weather stations, pyranometers, tracker controllers, or transformer sensors.
The selected instrumentation should identify:
- Plant name and site
- Inverter, combiner, string, or device
- Firmware and equipment model
- Block, zone, or geographic position
- Measurement timestamp
- Circuit or transaction class
- Commissioning and configuration state
Consistent metadata allows the platform to correlate related events. Without it, responders may see thousands of isolated data points without knowing which inverter, string, or block they belong to.
2. Collectors Receive and Process Signals
Data loggers and collectors receive telemetry from instrumented equipment and forward it to one or more backends. A collector may batch records, filter noise, enrich metadata, downsample readings, transform formats, or route different signals to different destinations.
A collector layer also reduces dependency on a single vendor. Open standards such as SunSpec Modbus provide a vendor-neutral approach for producing and exporting telemetry to compatible monitoring backends.
3. Ingestion Systems Store Time-Series and Event Data
Production data is frequently stored as time series: timestamped values associated with a measurement name and a set of labeled dimensions such as plant, inverter, and string.
The storage architecture must handle:
- Write volume across thousands of devices
- Query concurrency
- Device cardinality
- Event-log indexing
- Retention periods
- Data replication
- Regional or regulatory boundaries
High-cardinality labels can create a separate series for every module, connector, or unique identifier. This can increase memory use, storage consumption, query latency, and platform ingestion charges.
4. Analytics Establish Normal and Abnormal Behavior
The platform evaluates telemetry through static thresholds, dynamic baselines, expected-power modeling, peer comparison between strings, anomaly detection, or performance-ratio calculations.
A static threshold might trigger when inverter temperature exceeds a defined limit. A dynamic rule might trigger when a string’s output falls significantly below its neighbors under the same irradiance.
Dynamic analysis is useful for variable weather, but it must not replace explicit performance objectives. A plant that is consistently soiled may appear statistically normal while still violating its contractual performance ratio.
5. Dashboards Present Operational Context
Dashboards organize live and historical data into views for operators, technicians, asset managers, and owners.
A useful dashboard answers a decision question. Examples include:
- Is the plant meeting its performance-ratio guarantee?
- Which block is producing the lowest specific yield?
- Did the recent inverter firmware update reduce output?
- Which strings are underperforming their peers?
- Is soiling loss growing faster than the cleaning schedule addresses?
A dashboard that contains dozens of unrelated charts without a defined decision purpose creates visual noise rather than operational clarity.
6. Alerts Route Actionable Faults
Alarm rules evaluate defined conditions at scheduled intervals: a combination of a measurement, a triggering condition, an evaluation interval, and a duration for which the condition must remain true.
Alarm management can group, deduplicate, silence, inhibit, and route alerts. These functions help prevent multiple symptoms of one fault from paging responders separately.
An alert should contain:
- The affected plant or device
- The violated condition
- Current and expected values
- Severity
- Energy or revenue impact
- Recent maintenance or configuration context
- Dashboard and drill-down links
- Responsible team
- Relevant response procedure
- Escalation policy
What Telemetry Signals Should Be Collected?
A comprehensive monitoring platform should collect production metrics, event logs, device-level data, operational events, and environmental measurements. Each signal answers a different diagnostic question.
| Signal | Primary question answered | Example |
|---|---|---|
| Production metrics | What changed and by how much? | Performance ratio dropped from 82% to 71% |
| Event logs | What fault did the system record? | Inverter reported ground-fault interrupt |
| Device-level data | Where did the energy loss occur? | String 14 producing 40% below peers |
| Operational events | What change occurred? | Firmware 4.18 deployed at 14:05 |
| Environmental data | What were the conditions? | Plane-of-array irradiance 780 W/m² |
| Meter data | What did the grid actually receive? | Export reduced 12% by curtailment |
| Thermal data | Is equipment overheating? | Inverter cabinet temperature reached 68°C |
Production Metrics Show Scale and Direction
Metrics are efficient for evaluating large fleets over time. Common metric types include cumulative counters, instantaneous gauges, and aggregated summaries.
Use counters for cumulative values that increase, such as lifetime energy produced, and gauges for values that rise and fall, such as instantaneous power or module temperature.
Useful metrics include:
- Active power output (kW)
- Energy produced (kWh)
- Performance ratio
- Specific yield (kWh/kWp)
- Capacity factor
- Inverter efficiency
- DC and AC voltage and current
- String current deviation
- Module and cabinet temperature
- Soiling ratio
- Availability
Event Logs Provide Fault-Level Evidence
Event logs record discrete faults such as inverter trips, ground faults, arc-fault detections, communication timeouts, grid disconnections, or configuration changes. Structured logs are more useful than raw fault codes because fields can be searched, grouped, filtered, and correlated.
A useful structured event entry may include:
- Timestamp
- Severity
- Plant and device
- Fault code and description
- Equipment model and firmware
- Block or zone
- Relevant circuit identifier
Sensitive data such as site access credentials, SCADA control tokens, and network configuration should be removed or masked before storage.
Device-Level Drill-Down Reveals Where Losses Occur
Device-level and string-level analysis follows production down through inverters, combiner boxes, and strings. It is especially valuable when a plant underperforms but overall inverter status looks normal.
Drill-down can show that a block’s total output was 10% low, with one inverter accounting for most of the loss and, within it, three strings reading near-zero current. Production metrics reveal the shortfall, while drill-down identifies where the energy was lost.
On-Site and Satellite Irradiance Validate Expectation
On-site sensors (pyranometers and reference cells) measure irradiance directly at the array. Satellite or modeled irradiance provides an independent estimate even when a sensor fails.
On-site data reflects genuine local conditions such as clouds, dust, and shading. Satellite data provides a repeatable reference for validation. Using both allows teams to distinguish real production faults from irradiance changes or a failing sensor.
Which Metrics Matter Most for Solar Yield?
The most useful yield metrics measure production performance, response speed, equipment stress, and the amount of performance risk being consumed.
The Four Essential Signals
Production, irradiance, faults, and equipment stress are the four essential signals for monitoring solar plants.
Production. Production measures actual energy output against expectation. Teams should compare output to a model driven by measured irradiance, temperature, and rated capacity, because raw kWh alone hides whether conditions were favorable or poor.
Use performance ratio and specific yield rather than absolute output. A plant can produce high energy on a sunny day while still underperforming its potential.
Irradiance. Irradiance measures available sunlight, such as plane-of-array or global horizontal irradiance. It provides context for production and equipment changes.
A power drop during a cloud event may be expected. The same drop under stable irradiance may indicate soiling, a tripped inverter, disconnected strings, or a malfunctioning tracker.
Faults. Faults measure inverter trips, ground faults, arc faults, communication losses, curtailment, or violated performance conditions. A device reporting “online” should not be treated as proof of healthy production.
An inverter may report a valid status while silently clipping or feeding a fraction of its capacity because of a downstream configuration issue. Energy-level performance metrics should therefore accompany device-level status.
Equipment stress. Equipment stress measures how close constrained equipment is to its practical limit. Examples include inverter temperature, transformer loading, cabinet cooling, DC/AC clipping headroom, and tracker motor load.
Stress alerts should be tied to observed performance risk rather than one universal threshold. Some inverters operate safely at high temperature, while others derate or trip because of thermal, cooling, or contamination issues.
Reliability and Response Metrics
| Metric | What it measures | Operational use |
|---|---|---|
| Availability | Proportion of capacity able to produce | Tracks the reliability objective |
| Performance ratio | Actual versus expected output | Measures overall plant health |
| MTTD | Time from fault start to detection | Evaluates monitoring sensitivity |
| MTTA | Time from alarm to acknowledgment | Evaluates routing and ownership |
| MTTR | Time from fault start to restoration | Evaluates recovery capability |
| Energy loss | Estimated kWh lost per fault | Prioritizes response by revenue |
| Alarm precision | Percentage of alarms requiring action | Identifies noisy alerting |
| Monitoring coverage | Critical devices with defined signals | Reveals blind spots |
| Recurrence rate | Faults repeated from known causes | Evaluates corrective quality |
How Much Lost Production Does an Availability Target Allow?
An availability target translates directly into a maximum downtime allowance. The exact calculation depends on the measurement window and whether availability is based on time, capacity, or energy.
| Availability target | Approximate annual downtime |
|---|---|
| 97% | 10 days, 22 hours |
| 98% | 7 days, 7 hours |
| 99% | 3 days, 15 hours, 39 minutes |
| 99.5% | 1 day, 19 hours, 48 minutes |
| 99.9% | 8 hours, 46 minutes |
A target of 99 percent does not mean every string must individually achieve 99 percent. Plant architecture, inverter redundancy, string-level isolation, and rapid response determine whether component failures become significant energy losses.
Teams should also avoid reporting availability solely through inverter uptime. Energy-based availability often represents true impact more accurately because it measures the proportion of expected energy actually delivered.
What Is the Difference Between Monitoring and Diagnostics?
Monitoring evaluates known health conditions, while deeper diagnostics help engineers investigate performance losses that were not fully anticipated when dashboards and alarms were created.
Monitoring commonly asks:
- Is the inverter online?
- Is the performance ratio below target?
- Is any device faulting?
- Is temperature exceeding a limit?
Diagnostics ask broader investigative questions:
- Which block, orientation, firmware, and string type share the loss?
- Which component added the largest shortfall?
- What changed before the symptom appeared?
- Why does the loss affect one inverter but not its neighbor?
Monitoring remains essential. Diagnostics expand the range of questions engineers can answer when the loss is subtle, distributed, intermittent, or dependent on weather and configuration.
What Types of Monitoring Platforms Are Available?
Most solar operators need several monitoring capabilities, although one platform may combine multiple categories.
| Platform category | Primary scope | Best use |
|---|---|---|
| Inverter monitoring | Inverter status, power, faults | Detecting conversion problems |
| String-level monitoring | Combiner and string currents | Locating underperforming circuits |
| Module-level monitoring | Per-panel power electronics | Pinpointing single-panel faults |
| Environmental monitoring | Irradiance, temperature, wind | Validating expected production |
| Meter and revenue monitoring | Export, billing, curtailment | Measuring delivered energy |
| SCADA and control | Plant-wide supervision and control | Utility-scale operations |
| Portfolio management | Fleet-wide performance | Comparing many sites |
| Alarm and work-order systems | Faults, dispatch, tracking | Managing field response |
Inverter and String Monitoring
Inverter monitoring focuses on power conversion, DC input health, AC output, temperature, and fault codes. String monitoring adds visibility into individual circuits so a single failed string can be isolated rather than lost in the inverter average.
This layer is most valuable when the primary risk exists inside power electronics and circuit connections. It is less complete when soiling, shading, or environmental factors dominate losses.
Module-Level Monitoring
Module-level power electronics report per-panel output. This is useful for pinpointing hot spots, single-panel degradation, or localized shading that string-level data would average away. It adds cost and data volume, so it is often reserved for residential, commercial rooftop, or high-value sites.
Environmental Monitoring
Environmental monitoring evaluates irradiance, module temperature, ambient temperature, wind, and soiling. Healthy inverter status does not prove a plant is capturing its available energy; environmental data provides the reference needed to judge performance fairly.
SCADA and Utility-Scale Supervision
SCADA systems supervise and control large plants, including trackers, transformers, curtailment commands, and grid compliance. They become critical when a plant must respond to grid operator instructions and meet interconnection requirements in real time.
Commercial SaaS or Open Source: Which Is Better?
Commercial SaaS is generally better for operators that need rapid deployment, integrated support, and lower operational ownership. Open-source or self-hosted monitoring is generally better for teams that have strong engineering capabilities, require extensive control, or manage very large fleets economically.
| Criterion | Commercial SaaS | Open-source / self-hosted |
|---|---|---|
| Initial deployment | Usually faster | Usually requires more engineering |
| Operational maintenance | Vendor managed | Team managed |
| Licensing expense | Subscription or per-device | Often no license fee |
| Infrastructure expense | Included | Paid directly |
| Customization | Vendor features | Extensive |
| Data control | Contract dependent | Potentially complete |
| Support | Contractual | Community or paid |
| Internal staffing need | Lower at the start | Higher |
Choose Commercial SaaS When
- The team needs production visibility quickly.
- There is limited capacity to operate monitoring infrastructure.
- Managed analytics and integrated work-order workflows are valuable.
- Contractual support is required.
- Consolidating multiple sites is more important than maximum customization.
Choose Open Source When
- The organization has an experienced platform or operations team.
- Data location and control are strict requirements.
- Fleet volumes make per-device pricing difficult to sustain.
- Engineers need custom integrations or storage architectures.
- Operating the stack is an accepted internal responsibility.
Consider a Hybrid Architecture
A hybrid model can use open-source time-series storage for high-volume device telemetry while retaining a commercial platform for portfolio analytics, performance reporting, or alarm workflows. This controls cost but introduces integration complexity. Teams must define which platform is authoritative for alarms, performance, retention, and investigation.
How Should a Platform Be Selected?
A monitoring platform should be selected by mapping reliability risks and operational requirements to platform capabilities. Feature quantity alone is a poor selection criterion.
Evaluate each candidate against the following factors:
- Equipment coverage: Does it support your inverters, meters, trackers, combiners, and sensors?
- Telemetry standards: Can it receive and export SunSpec Modbus, IEC 61850, or similar data?
- Correlation: Can engineers move from an alarm to related production, events, and device data?
- Cardinality controls: Can the platform handle string- or module-level data economically?
- Alerting: Does it support grouping, deduplication, routing, inhibition, escalation, and maintenance windows?
- Performance modeling: Can teams define expected output, performance-ratio targets, and loss budgets?
- Data governance: Are retention, encryption, access control, and regional storage adequate?
- Integration: Does it connect with SCADA, CMMS/work-order tools, and reporting systems?
- Query performance: Can responders investigate large fleets during events?
- Ownership cost: What are the full costs of devices, ingestion, storage, users, and staffing?
Platform Evaluation Scorecard
Score each category from 1 to 5 and apply weights based on business importance.
| Category | Suggested weight |
|---|---|
| Critical-equipment coverage | 20% |
| Investigation and correlation | 15% |
| Alarm quality and routing | 15% |
| Scalability and performance | 10% |
| Security and compliance | 10% |
| Open standards and portability | 10% |
| Total cost of ownership | 10% |
| Ease of operation | 5% |
| Vendor support and roadmap | 5% |
A proof of concept should use representative production telemetry from an operating site. A small demonstration with one inverter rarely exposes cardinality, query performance, retention, or cost problems.
How Much Do Monitoring Platforms Cost?
Monitoring platform costs typically range from a few hundred dollars per year for small rooftop systems to six or seven figures for large utility fleets. The largest cost drivers are device count, data resolution, retention, user licensing, premium analytics, and internal labor.
The following ranges are planning estimates, not vendor quotations:
| System profile | Typical annual platform budget | Typical deployment period |
|---|---|---|
| Residential rooftop | $0 to $300 | Same day to 1 week |
| Commercial / industrial | $1,000 to $10,000 | 1 to 4 weeks |
| Utility-scale plant | $10,000 to $150,000+ | 1 to 6 months |
| Self-hosted fleet | Varies widely | 1 to 6 months |
Open source does not mean free. A self-managed stack can require compute, storage, backups, upgrades, scaling, on-call support, security patching, and specialized engineering.
Hidden Cost Drivers
Common hidden costs include:
- High-resolution module-level data at scale
- Duplicate telemetry from overlapping systems
- Long retention for low-value data
- Cellular or satellite data transfer from remote sites
- Premium user seats
- Query-intensive dashboards
- Multiple overlapping platforms
- Staff time maintaining data loggers and gateways
A cost-control program should classify telemetry by operational value. Critical revenue, compliance, and fault records may justify long retention, while verbose device chatter may require short retention.
How Should Real-Time Monitoring Be Implemented?
A reliable implementation should proceed in eight stages, beginning with performance objectives rather than device installation.
Step 1: Inventory Critical Assets
List plants, blocks, inverters, combiners, meters, trackers, sensors, and grid connection points. Classify each asset by capacity, revenue impact, recovery priority, and responsible team.
Success checkpoint: Every critical block has a named owner and mapped equipment.
Step 2: Define Performance Indicators
Select measurable indicators that represent energy outcomes, such as performance ratio, specific yield, energy-based availability, or expected-versus-actual output. Avoid choosing indicators only because they are easy to collect.
Success checkpoint: Each indicator can be explained as an energy success or loss.
Step 3: Set Objectives and Loss Budgets
Define performance targets for a measurement period. A loss budget is the amount of underperformance allowed by the objective. Use loss-budget consumption to guide maintenance priority and dispatch decisions.
Success checkpoint: Teams know what action to take when performance is healthy, declining, or exhausted.
Step 4: Instrument the Critical Path
Instrument inverters, combiners, meters, and environmental sensors. Apply consistent plant, device, block, and firmware metadata. Begin with the equipment that drives most production rather than every panel.
Success checkpoint: Production can be followed from the meter down to major devices.
Step 5: Build Asset-Centered Dashboards
Create dashboards around plants and decisions. A plant dashboard should show performance-ratio compliance, expected-versus-actual output, irradiance, string deviation, equipment temperature, faults, and recent maintenance.
Success checkpoint: An operator can determine impact, scope, and likely device within minutes.
Step 6: Configure Actionable Alarms
Page only when timely human action is required. Route lower-priority conditions to tickets or working-hours channels. Prefer alarms based on real energy loss, performance-ratio deviation, sustained equipment stress, and critical faults.
Success checkpoint: Every paging alarm has an owner, severity, procedure, and defined response.
Step 7: Test Fault Detection
Run controlled exercises. Examples include disconnecting a test string, simulating an inverter fault, or injecting a communication loss. Verify that the correct alarm fired, symptoms were grouped, the correct team was notified, and drill-down exposed the cause.
Success checkpoint: The monitoring system has demonstrated it detects representative faults.
Step 8: Review Telemetry and Alarms Regularly
Monitoring requires continuous maintenance because equipment, weather patterns, and ownership change. Review noisy alarms, missed events, unused dashboards, broken sensors, data-logger failures, retention policies, and cost by site.
Success checkpoint: Monitoring quality improves after events instead of accumulating permanent noise.
How Should Alarms Be Designed?
An alarm should indicate a meaningful condition, require a specific response, and reach the team capable of taking that response.
Use Multiple Severity Levels
- Critical: Active major production loss, safety risk, or grid-compliance risk requiring immediate response
- High: Significant underperformance likely to worsen without prompt action
- Medium: Limited loss that can be handled during working hours
- Informational: Operational context that does not require a dispatch
Do not page someone merely because a metric crossed a threshold. Page because the condition threatens energy or safety and human intervention is required.
Add Evaluation Windows
Instant alarms on volatile measurements create noise, because clouds and momentary readings fluctuate constantly. Require a condition to persist for an appropriate period or use a rolling window. A full inverter outage may justify near-immediate paging, while a small performance dip may need sustained deviation before alerting.
Use Loss-Rate Alarms
Loss-rate alarms measure how quickly a plant consumes its performance budget. A high loss rate across a short window detects severe faults quickly. A lower loss rate across a longer window detects persistent degradation such as gradual soiling without excessive sensitivity to passing clouds.
Group Related Symptoms
One transformer or communication failure can trigger many inverter faults, string alarms, and meter anomalies at once. Grouping alarms by plant, block, or fault fingerprint prevents responders from receiving a separate page for every symptom.
How Should a Production Loss Be Investigated?
A production loss should be investigated by verifying energy impact, defining scope, identifying the failing device, checking recent changes, applying the safest correction, and confirming recovery.
- Confirm the impact. Check performance ratio, meter data, and expected-versus-actual output. Determine which blocks are affected, when the loss began, and whether it is growing.
- Establish a timeline. Record the first symptom, alarm time, acknowledgment, recent maintenance, firmware changes, weather events, and grid events. A precise timeline prevents assumptions about what changed first.
- Compare healthy and unhealthy segments. Compare affected and unaffected inverters, strings, orientations, blocks, and firmware versions. Differences often isolate the cause faster than reviewing plant-wide averages.
- Follow the energy path. Use drill-down and topology maps to locate the low-producing device, then inspect its metrics and event logs. This is more efficient than searching all logs without narrowing the device and time range first.
- Review recent changes. Firmware updates, configuration changes, tracker settings, and cleaning schedules are common triggers, but verify correlation rather than assuming every loss is change-related.
- Correct before perfect diagnosis. During a severe loss, restoring production usually matters more than proving the complete root cause. Options include resetting an inverter, reconnecting a string, releasing a stuck tracker, or clearing a curtailment, following predefined safety criteria.
- Verify recovery. Do not close an event because one metric recovered. Confirm that output matches expectation, faults have cleared, temperatures are normal, and the plant is exporting correctly.
Common Monitoring Mistakes and How to Fix Them
Alarm fatigue. Engineers receive excessive, repetitive, or non-actionable alarms and begin ignoring them. Fix: measure alarm precision, remove alarms without defined action, group symptoms, use persistence windows, and route nonurgent conditions away from paging channels.
Monitoring every data point. Teams collect all available telemetry without identifying operational value. Fix: begin with performance ratio, production, faults, and key equipment. Add telemetry when it answers a defined question.
Ignoring environmental context. Production is judged in raw kWh without irradiance. Fix: always compare output to an expected model driven by measured irradiance and temperature.
Missing device context. Faults reference a device without knowing its block, string, or owner. Fix: maintain consistent plant, block, string, and ownership metadata.
Inverter-only monitoring. Inverters appear healthy while strings, modules, or trackers fail silently. Fix: add string-level or module-level monitoring and environmental sensors.
Dashboard sprawl. Teams create hundreds of dashboards with no ownership. Fix: assign owners, define intended decisions, and standardize plant dashboards.
Static thresholds without context. One threshold is applied across sites with different climate and design. Fix: use site-specific baselines, peer comparison, and performance-ratio targets.
No monitoring for the monitoring system. Data loggers, gateways, and sensors fail silently, hiding real production. Fix: monitor data freshness, logger health, and sensor validity with canary checks.
How Can Monitoring Costs Be Controlled?
Monitoring costs can be controlled by reducing low-value data, choosing appropriate resolution, shortening noncritical retention, and assigning telemetry budgets to sites.
Apply Tiered Retention
An example policy is:
- High-resolution production data: 15 to 90 days
- Downsampled production data: several years
- Revenue and compliance records: per regulatory requirement
- Fault and event logs: 90 days to 1 year
- Verbose device chatter: hours to days
Use Appropriate Data Resolution
Sub-minute data is valuable for troubleshooting inverter faults but expensive at fleet scale. Match resolution to the decision: fast intervals for power and fault signals, slower intervals for temperature trends or soiling that change slowly.
Control Device Cardinality
Reserve module-level detail for high-value or troublesome sites, and use string-level data as the default for utility scale. Avoid attaching unbounded identifiers to time-series metrics; keep those in event logs instead.
Set Site Telemetry Budgets
Show teams the ingestion, retention, and query cost of their sites. Cost visibility encourages engineers to remove duplicate feeds, unnecessary detail, and unused data.
Expert Insights for Higher Yield
The earliest alarm is not always the best alarm. A highly sensitive alarm may fire on every passing cloud but provide little evidence. The best alarm identifies meaningful energy loss early enough for action and includes sufficient context for the receiving team.
Performance must be defined against expectation. Inverter teams may report healthy equipment while asset managers report shortfalls against the model and owners still see reduced revenue. Reliability should be measured against expected energy for the actual conditions.
Monitoring quality is proven during stress. A platform may look complete during clear-sky operation. Its true quality becomes visible during faults, firmware changes, grid events, curtailment, storms, and seasonal shifts.
Monitoring cannot repair weak design. Monitoring can reveal a single point of failure such as one central inverter, but it cannot create redundancy. It can warn that a transformer is overloaded, but it cannot add capacity unless design and controls support that action.
High yield requires both visibility and engineering controls such as string-level protection, redundant inverters, quality connectors, tracker maintenance, soiling management, safe firmware deployment, and tested recovery procedures.
Recommendations by Operator Type
Residential and small commercial. Monitor total production, performance against expectation, inverter faults, and a simple availability check. A managed platform usually saves more time than a self-hosted stack. Focus on knowing quickly when the system stops producing.
Commercial and industrial portfolios. Standardize device naming, ownership, performance indicators, and alarm routing across sites. String-level monitoring is often worthwhile for revenue-critical arrays. Introduce portfolio comparison to spot underperforming sites.
Utility-scale operators. Prioritize SCADA integration, grid compliance, standardized instrumentation, tracker and transformer monitoring, and tool consolidation. Central standards should not prevent site-specific indicators, since climate and design vary by plant.
Regulated and grid-connected operators. Evaluate encryption, access logging, retention, data residency, and separation of duties. Treat telemetry pipelines and SCADA control as security-sensitive systems.
Real-Time Performance Monitoring Implementation Checklist
- Identify critical plants and blocks.
- Define asset owners and equipment maps.
- Select energy-centered performance indicators.
- Set performance-ratio and availability objectives.
- Calculate loss budgets.
- Instrument inverters, meters, and sensors.
- Standardize plant and device metadata.
- Capture maintenance and firmware events.
- Create asset-centered dashboards.
- Configure actionable alarms.
- Add grouping, deduplication, and escalation.
- Write and test response procedures.
- Monitor data-logger and sensor health.
- Test representative fault scenarios.
- Review alarm precision after events.
- Track data volume and ingestion costs.
- Apply retention and resolution policies.
- Audit access and control-system security.
- Review objectives as plants age and degrade.
Limitations of Real-Time Monitoring Platforms
Real-time monitoring platforms cannot guarantee uninterrupted production. They depend on accurate instrumentation, healthy data pipelines, appropriate retention, reliable alarm delivery, trained responders, and plant designs capable of recovery.
They are also not substitutes for:
- Quality module and connector selection
- Proper inverter sizing and redundancy
- Preventive maintenance and cleaning
- Tracker and transformer servicing
- Backup and disaster recovery
- Safe firmware and change control
- Grid-compliance testing
- Field-technician training
Automated anomaly detection can identify unusual behavior, but unusual does not always mean harmful. Weather variability, planned curtailment, seasonal angles, and maintenance can appear anomalous. Human context and explicit performance objectives remain necessary.
Frequently Asked Questions
Can real-time monitoring prevent all production loss? No. It cannot eliminate equipment failures, weather variability, grid curtailment, or operational mistakes. It reduces risk by detecting losses early, identifying affected equipment, and improving response speed. Preventing prolonged loss also requires redundancy, maintenance, safe changes, and trained responders.
How frequently should monitoring data be collected? Collection frequency should match the speed and importance of the monitored condition. Power and fault signals may need intervals of seconds to a minute, while soiling or temperature trends may need minutes or hours. Shorter intervals improve detection but increase data and cost.
Is inverter monitoring enough? Inverter monitoring is a strong foundation, but complete visibility may also require string- or module-level data, environmental sensors, revenue metering, and portfolio analytics. The required stack depends on plant scale, design, and operational maturity.
What should appear on an owner’s performance dashboard? An owner dashboard should show performance-ratio compliance, availability, energy produced versus expected, major event count, estimated revenue impact, and reliability trends. It should avoid low-level device data unless that data explains business risk.
Should every alarm notify the on-call team? No. Only conditions requiring immediate action should page on-call staff. Warnings, minor dips, and informational changes should route to tickets or working-hours channels. Every paging alarm should identify impact, ownership, urgency, and a defined response.
What is the first capability a small operator should implement? Monitor total production against expected output and get a fast alert when the system stops producing. Add fault status, performance ratio, and a basic availability check. This delivers more value than starting with hundreds of low-level data points.
Conclusion
Real-time performance monitoring for solar is not simply a matter of installing data loggers and displaying production graphs. Effective monitoring connects expected energy performance to production metrics, event logs, device-level data, environmental context, alarms, response procedures, and accountable teams.
The strongest monitoring program detects meaningful underperformance, explains its scope, supports safe correction, verifies recovery, and converts every event into improved instrumentation or engineering controls. Operators that combine this visibility with resilient plant design, disciplined maintenance, and tested response can reduce both the frequency and duration of energy losses — and protect the revenue their assets were built to produce.