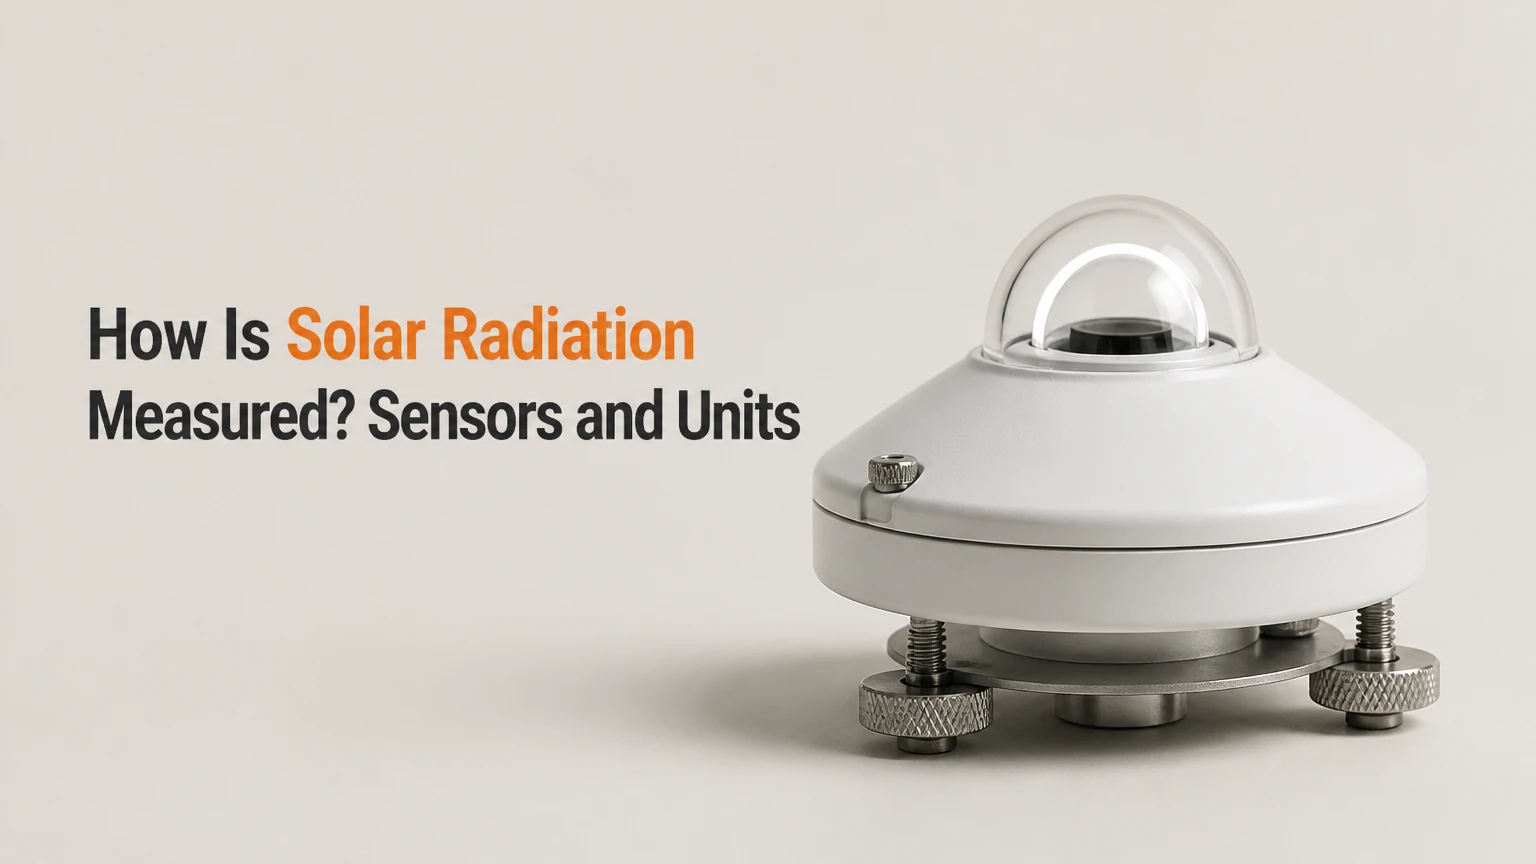
Solar radiation is measured with radiometers, especially pyranometers for hemispheric sunlight and pyrheliometers for direct sunlight. Instruments convert absorbed radiation into a calibrated electrical signal, reported as irradiance in watts per square metre (W/m²) or integrated irradiation in kilowatt-hours per square metre (kWh/m²).
Key Facts at a Glance
- A pyranometer measures shortwave radiation from the sky across a 180-degree field of view.
- Global horizontal irradiance equals the direct horizontal component plus diffuse horizontal irradiance: GHI = DNI × cos(θz) + DHI.
- Irradiance is an instantaneous or averaged power density in W/m²; irradiation is accumulated energy over time in Wh/m² or kWh/m².
- A thermopile sensor measures broadband absorbed heat, while a silicon reference cell measures a photovoltaic device’s spectral response.
- A pyrheliometer measures direct normal irradiance through a narrow tube and normally requires solar tracking.
- Sensor leveling, unobstructed exposure, clean optics, calibration, and temperature correction determine practical data quality.
What Does Solar Radiation Measurement Mean?
Solar radiation measurement means determining the radiant power or accumulated radiant energy arriving at a defined surface. The measurement is incomplete unless the surface orientation, spectral band, time interval, and radiation component are specified.
The Sun emits electromagnetic radiation across ultraviolet, visible, and infrared wavelengths. Ground instruments generally focus on shortwave solar radiation, while longwave terrestrial radiation is measured with separate pyrgeometers. The World Meteorological Organization identifies radiometers such as pyranometers and pyrheliometers as standard instruments for surface radiation observations.
A useful distinction is:
- Irradiance: power received per unit area at a moment or during an averaging interval, measured in W/m².
- Irradiation: energy received per unit area during a period, measured in Wh/m² or kWh/m².
- Radiant exposure: another term for time-integrated energy per unit area, common in radiometry.
For example, a sensor reading of 800 W/m² for 30 minutes represents 0.4 kWh/m² if the reading remains constant. Real systems integrate many samples, because clouds can change irradiance within seconds.
What Are GHI, DNI, DHI, and POA?
Global horizontal irradiance (GHI) is the total shortwave radiation received by a horizontal surface. GHI combines direct sunlight projected onto the horizontal plane with diffuse skylight scattered from the rest of the sky.
Direct normal irradiance (DNI) is the direct solar beam received by a surface held perpendicular to the Sun’s rays. Diffuse horizontal irradiance (DHI) is scattered sky radiation received by a horizontal surface, excluding the direct solar disk. Plane-of-array irradiance (POA) is the total irradiance received by a surface with a particular tilt and azimuth, such as a photovoltaic module.
The component relationship is:
[ GHI = DNI \times \cos(\theta_z) + DHI ]
Here, θz is the solar zenith angle, measured from vertical. Near solar noon, a horizontal surface receives a larger projected direct component than it does when the Sun is low, even if DNI remains similar.
| Quantity | Surface orientation | Radiation included | Main use |
|---|---|---|---|
| GHI | Horizontal, 0° tilt | Direct plus diffuse sky radiation | Weather stations and fixed-site resource assessment |
| DNI | Perpendicular to Sun’s beam | Direct beam only | Concentrated solar power and tracker analysis |
| DHI | Horizontal, with direct beam excluded | Scattered and reflected sky radiation | Diffuse modeling and bifacial PV analysis |
| POA | Module-specific tilt and azimuth | Direct, diffuse, and ground-reflected components | PV energy yield and performance ratio |
How Does a Pyranometer Measure Sunlight?
A pyranometer measures broadband shortwave irradiance by exposing a calibrated receiver to radiation from the sky dome. The receiver produces a voltage related to absorbed radiant power, and the instrument or data logger converts that voltage into W/m².
A thermopile pyranometer uses a blackened absorber connected to thermocouples. Radiation heats the absorber relative to a reference body, and the resulting thermoelectric voltage is proportional to the temperature difference. High-quality thermopile instruments are designed for a broad solar spectrum, typically about 285-2,800 nm under ISO 9060:2018 classifications, although the exact response depends on the model.
Silicon sensors generate photocurrent when photons create charge carriers in a semiconductor junction. Silicon instruments respond rapidly and cost less, but their spectral response does not match the full solar spectrum. Water vapor, aerosols, and cloud composition can therefore change the relationship between silicon output and broadband irradiance.
The instrument does not “count sunlight particles” directly. It measures a physical response, applies a sensitivity coefficient, and reports a radiometric estimate tied to calibration.
Which Units Describe Solar Radiation?
Solar radiation uses W/m² for irradiance and kWh/m² for accumulated energy. The daily resource value is commonly written as kWh/m²/day, although the “per day” notation describes the averaging period rather than a different physical unit.
| Measurement | Meaning | Example value | Typical application |
|---|---|---|---|
| Instantaneous irradiance | Power density at a sample time | 920 W/m² | PV operating check at 12:15 |
| Ten-minute average | Mean power density across 10 minutes | 735 W/m² | Meteorological data logging |
| Daily irradiation | Integrated energy over one day | 4.8 kWh/m² | Solar resource comparison |
| Annual irradiation | Integrated energy over one year | 1,650 kWh/m²/year | PV yield modeling |
A data logger calculates irradiation by numerical integration:
[ H = \sum_{i=1}^{n} G_i \times \Delta t ]
where (G_i) is irradiance and (\Delta t) is the sampling interval. If a logger records 1,000 W/m² for one hour, the accumulated energy is 1 kWh/m². Missing samples, incorrect time zones, and daylight-saving changes can corrupt daily totals even when the sensor itself works correctly.
Which Instruments Measure Solar Radiation?
The main instruments are pyranometers, pyrheliometers, shaded pyranometers, rotating shadowband radiometers, and photovoltaic reference cells. Each instrument measures a defined geometry, so choosing a sensor by price alone can produce data that cannot answer the intended engineering question.
| Instrument | Primary output | Field of view or geometry | Response type | Typical equipment cost |
|---|---|---|---|---|
| Thermopile pyranometer | GHI or POA | Hemispheric, about 180° | Broadband thermal | $600-$4,500 |
| Silicon pyranometer | GHI or POA estimate | Hemispheric, about 180° | Spectrally limited photovoltaic | $150-$800 |
| Pyrheliometer | DNI | Narrow direct beam | Broadband thermal | $1,500-$3,500 |
| PV reference cell | POA proxy | Same plane as module | Silicon photovoltaic | $100-$1,000 |
| Rotating shadowband system | GHI, DHI, modeled DNI | Sequential shaded and unshaded views | Usually silicon or thermopile | $4,000-$12,000 |
Prices are typical market ranges, not procurement guarantees. Enclosures, data loggers, ventilation, trackers, calibration, shipping, and installation can cost more than the sensing head.
How Should a Sensor Be Installed and Operated?
Reliable ground measurement requires a stable mount, correct orientation, clean optics, calibrated conversion, and documented maintenance. A professional installation typically follows seven actions.
Step 1: Define the radiation quantity
Choose GHI for a horizontal climate record, POA for PV performance, or DNI for concentrating collectors. A horizontal pyranometer cannot substitute directly for a pyrheliometer because the two sensors observe different geometries.
Step 2: Select the sensor class
Choose a thermopile pyranometer when broadband comparability and long-term resource assessment matter. Choose a reference cell when the question is how much sunlight a particular silicon PV technology receives under operating conditions.
ISO 9060:2018 uses instrument classifications including Class A, Class B, and Class C, with subcategories and performance parameters such as response time, zero offset, spectral error, temperature response, and directional response. Class labels should be checked against the manufacturer’s full declaration rather than treated as a single accuracy percentage.
Step 3: Mount and level the instrument
Install a GHI sensor horizontally with an unobstructed view of the sky. Use the leveling screws and spirit level, then inspect the level after the mount settles. For POA, align the sensor with the module’s tilt and azimuth, not merely with magnetic north.
Step 4: Remove shading and reflections
Keep trees, parapets, antennas, railings, and tracker components outside the relevant sun path. A shadow lasting five minutes can materially reduce a daily total, particularly during clear conditions when the affected interval would otherwise have high irradiance.
Step 5: Connect the signal chain
Record the sensor’s serial number, sensitivity coefficient, output type, logger units, time zone, sampling interval, and temperature compensation settings. A common analog conversion is:
[ G = \frac{V_{\text{out}} – V_{\text{offset}}}{S} ]
where (S) is sensitivity in V per W/m². Manufacturers may express sensitivity in µV per W/m², so unit conversion must occur before calculating irradiance.
Step 6: Log and integrate data
Use a one-minute or ten-minute interval for most PV monitoring, with shorter sampling when studying cloud transients or tracker behavior. Store raw voltage as well as converted W/m² so a later calibration review can distinguish sensor failure from software conversion error.
Step 7: Inspect and validate the record
Clean the dome or window according to the manufacturer’s instructions, inspect cable glands, compare the curve with solar elevation, and check nighttime values. A healthy shortwave sensor should approach zero at night, apart from small offsets and electrical noise.
How Accurate Are Solar Radiation Measurements?
Measurement accuracy depends on the instrument’s classification, calibration, installation, environment, and data processing. A Class A instrument can still produce poor data when a bird dropping, nearby shadow, incorrect sensitivity, or unverified tilt affects the installation.
The ISO 9060 standard defines performance requirements rather than promising one universal field accuracy number. The World Meteorological Organization’s measurement guidance also treats exposure, maintenance, calibration, and uncertainty as parts of the observing system, not optional accessories.
| Error source | Typical effect | Diagnostic sign | Corrective action |
|---|---|---|---|
| Thin dust or bird contamination | 1%-15% low bias | Smoothly depressed daytime curve | Clean and compare before-after readings |
| Small mounting tilt error | About 1%-5%, season-dependent | Seasonal bias or azimuth asymmetry | Relevel and survey orientation |
| Short obstruction shadow | 5%-100% during obstruction | Narrow dips at repeatable times | Remove obstruction or relocate sensor |
| Silicon spectral mismatch | 1%-10% under changing spectra | Divergence from thermopile during clouds | Apply validated correction or use broadband sensor |
| Thermopile zero offset | 1-10 W/m² near low light | Nonzero night readings | Inspect thermal environment and recalibrate |
| Incorrect logger coefficient | 10% to several hundred percent | Implausible constant scale error | Verify units and calibration certificate |
The percentages above are practical diagnostic ranges, not guaranteed error budgets. A bankable assessment should use the manufacturer’s uncertainty specification, calibration history, site inspection, and quality-control rules.
What Is the Difference Between a Thermopile and Silicon Sensor?
Thermopile sensors provide broader spectral measurement, while silicon sensors provide faster response and lower cost. Neither technology is automatically superior because the correct choice depends on whether the measurement must represent broadband solar energy or a specific PV device.
| Attribute | Thermopile | Silicon photodiode | Practical consequence |
|---|---|---|---|
| Physical signal | Thermoelectric voltage from heating | Photocurrent from photons | Different calibration mechanisms |
| Spectral behavior | Broad shortwave response | Silicon-limited response | Spectral mismatch is larger for silicon |
| Response time | Typically seconds | Typically milliseconds | Silicon captures fast cloud changes |
| Temperature effects | Requires compensation | Requires compensation | Both need environmental correction |
| Cost | Higher at professional grades | Lower for field meters | Budget does not equal suitability |
| Best use | Resource assessment and meteorology | PV commissioning and operational checks | Match sensor to decision |
A reference cell can be the better operational instrument for a silicon PV array because it experiences similar spectral and temperature behavior. The same reference cell is a poor replacement for a broadband climate record when comparisons must remain consistent across changing atmospheric conditions.
How Is DNI Measured?
DNI is measured with a pyrheliometer mounted on a solar tracker that keeps the instrument’s narrow acceptance axis pointed at the Sun. A collimating tube limits the view to the direct solar beam and rejects most diffuse sky radiation.
The tracker must follow solar position accurately throughout the day. Misalignment can reduce the beam entering the aperture, especially when the Sun is low or when the instrument has a narrow acceptance angle. Pyrheliometer systems therefore require more mechanical inspection than fixed pyranometers.
DNI is especially important for concentrating solar power, solar concentrator testing, and direct-beam atmospheric research. For ordinary fixed-tilt PV, POA or GHI usually provides a more relevant performance reference than DNI alone.
How Do Clouds and Atmosphere Affect Readings?
Clouds, aerosols, water vapor, ozone, and solar elevation alter both the amount and spectral composition of radiation reaching the ground. A cloud can reduce direct beam irradiance sharply while increasing diffuse irradiance near bright cloud edges.
A broadband thermopile records the total radiometric effect. A silicon sensor records the effect filtered through silicon’s spectral response, so two correctly functioning instruments can disagree during rapidly changing cloud or aerosol conditions.
The atmosphere also changes the path length through which sunlight travels. At low solar elevation, the longer path increases scattering and absorption, and the horizontal projection of direct radiation decreases according to the cosine of the zenith angle.
How Much Does Solar Radiation Measurement Equipment Cost?
A basic handheld silicon irradiance meter typically costs $100-$400, while a permanent professional station can cost $2,000-$20,000 after mounting, logging, calibration, and maintenance are included. Pyrheliometer systems cost more because a tracker is normally required.
| Setup | Sensor package | Installation burden | Typical total cost | Suitable decision |
|---|---|---|---|---|
| Handheld PV check | Silicon meter or reference cell | Minutes, manual orientation | $100-$400 | Spot-checking modules |
| Rooftop monitoring | Silicon or Class B pyranometer plus logger | Half-day to one day | $800-$3,000 | PV troubleshooting |
| Commercial PV station | Two pyranometers plus logger | One to two days | $3,000-$10,000 | Performance monitoring |
| DNI research station | Class A pyrheliometer and tracker | One to three days | $5,000-$20,000 | CSP and resource assessment |
Calibration intervals are not universal. Many operators arrange recalibration every one to two years, while research networks may use shorter intervals or side-by-side comparisons. The manufacturer, contract, standard, drift history, and required uncertainty should determine the interval.
Which Sensor Is Best for Photovoltaic Testing?
A calibrated reference cell is usually best for a quick PV operating check, a POA thermopile pyranometer is better for technology-neutral performance monitoring, and a full GHI-DHI-DNI station is appropriate for a solar resource study. The decision follows the measurement objective, not the largest advertised accuracy figure.
| User situation | Recommended sensor | Minimum useful setup | Main limitation |
|---|---|---|---|
| Homeowner checking output | Handheld silicon meter | Meter, module tilt, irradiance reading | Spot measurement is not a resource record |
| Installer commissioning strings | Calibrated reference cell | Reference cell in module plane | Spectral response differs by technology |
| Commercial PV operator | Class B or Class A pyranometer | POA sensor, logger, temperature data | Higher cost and maintenance |
| CSP developer | Pyrheliometer | Tracker, DNI sensor, quality-controlled logger | Alignment and tracker errors |
| University weather station | Class A pyranometers | GHI, DHI, optional DNI, calibration records | Requires documented operations |
A common practitioner rule is to place the irradiance sensor in the same plane as the modules when calculating instantaneous PV performance ratio. Comparing module output against horizontal GHI can introduce a geometry error before temperature, inverter losses, and soiling are considered.
What Alternatives Exist to Ground Sensors?
Satellite-derived irradiance, numerical weather models, sunshine-duration instruments, and nearby weather stations can estimate solar resource when ground sensors are unavailable. Alternatives are useful for screening and gap filling, but they do not reproduce every local effect measured at the project site.
Satellite products infer surface irradiance from cloud and atmospheric observations, then apply physical models. The National Renewable Energy Laboratory’s National Solar Radiation Database combines modeled and satellite-based information for locations and periods without complete ground observations.
Sunshine-duration instruments indicate whether direct sunlight exceeds a threshold, but they do not measure the full irradiance spectrum. A nearby station can support plausibility checks, although distance, elevation, coastal clouds, terrain, and urban aerosols may make direct substitution unreliable.
For a project decision, use modeled data for early screening, then validate the final design with a properly installed ground instrument when local uncertainty affects financing or equipment sizing.
What Causes Incorrect Solar Radiation Readings?
The most frequent field failures are contamination, shading, wrong orientation, incorrect conversion coefficients, thermal offsets, and missing time synchronization. Many apparent sensor failures are actually installation or data-processing failures.
Use this troubleshooting sequence:
- Check nighttime values. Persistent nonzero readings suggest offset, wiring, thermal drift, or logger problems.
- Inspect the optical surface. Remove dust, dew, frost, bird contamination, and salt deposits using approved materials.
- Review the daily curve. Repeated narrow dips usually indicate shadows; a smooth low bias often indicates soiling or incorrect calibration.
- Verify geometry. Confirm horizontal leveling, POA tilt, azimuth, tracker alignment, and the sensor’s field of view.
- Verify units. Check whether the logger expects V per W/m², µV per W/m², or a current-loop output.
- Compare instruments. Side-by-side comparison with a recently calibrated sensor can isolate a faulty channel.
- Review weather context. Cloud variability can create genuine differences between direct, diffuse, broadband, and silicon measurements.
The “silicon shimmer” problem is real but often overstated. Silicon does not become inaccurate in every condition; its error grows when the spectrum differs from the calibration spectrum or from the PV technology being represented.
Frequently Asked Questions
Can a solar panel measure solar radiation?
A solar panel measures electrical output, not solar irradiance directly. Module current depends on irradiance, cell temperature, spectrum, angle of incidence, wiring, inverter operation, and degradation, so panel output can estimate sunlight only after calibration against a reference sensor.
What is the difference between solar radiation and solar irradiance?
Solar radiation is the broad physical phenomenon of electromagnetic energy from the Sun. Solar irradiance is the measured power density of that radiation at a surface, expressed in W/m², while solar irradiation is the accumulated energy received over time.
Can a phone measure solar irradiance?
A phone can provide a rough light estimate through its camera or ambient-light sensor, but those sensors are not calibrated broadband radiometers. Phone readings are unsuitable for PV guarantees, resource assessment, or comparisons across devices unless a traceable external sensor supplies the measurement.
How often should a pyranometer be cleaned?
Inspect a pyranometer daily or weekly according to site conditions, and clean it whenever dust, dew, frost, salt, or bird contamination is visible. Desert, agricultural, and coastal sites may require more frequent cleaning than sheltered urban locations.
Why does a reference cell disagree with a pyranometer?
A reference cell and pyranometer respond to different spectral distributions and may have different tilt, temperature, shading, or calibration histories. Disagreement during changing cloud or aerosol conditions does not automatically indicate failure; geometry and spectral response must be checked first.
Is W/m² the same as kWh/m²?
W/m² measures power at an instant or averaged interval, whereas kWh/m² measures accumulated energy. A constant 1,000 W/m² lasting one hour produces 1 kWh/m², but a daily kWh/m² value requires integrating all changing irradiance readings.
The Bottom Line
How is solar radiation measured? A calibrated radiometer measures the radiation reaching a defined surface, converts the sensor response into irradiance in W/m², and integrates logged values into irradiation in kWh/m². Use a pyranometer for broadband hemispheric radiation, a pyrheliometer for DNI, and a reference cell for PV-plane operational checks. Reliable results require correct geometry, clean optics, verified calibration, accurate logging, and documented quality control.