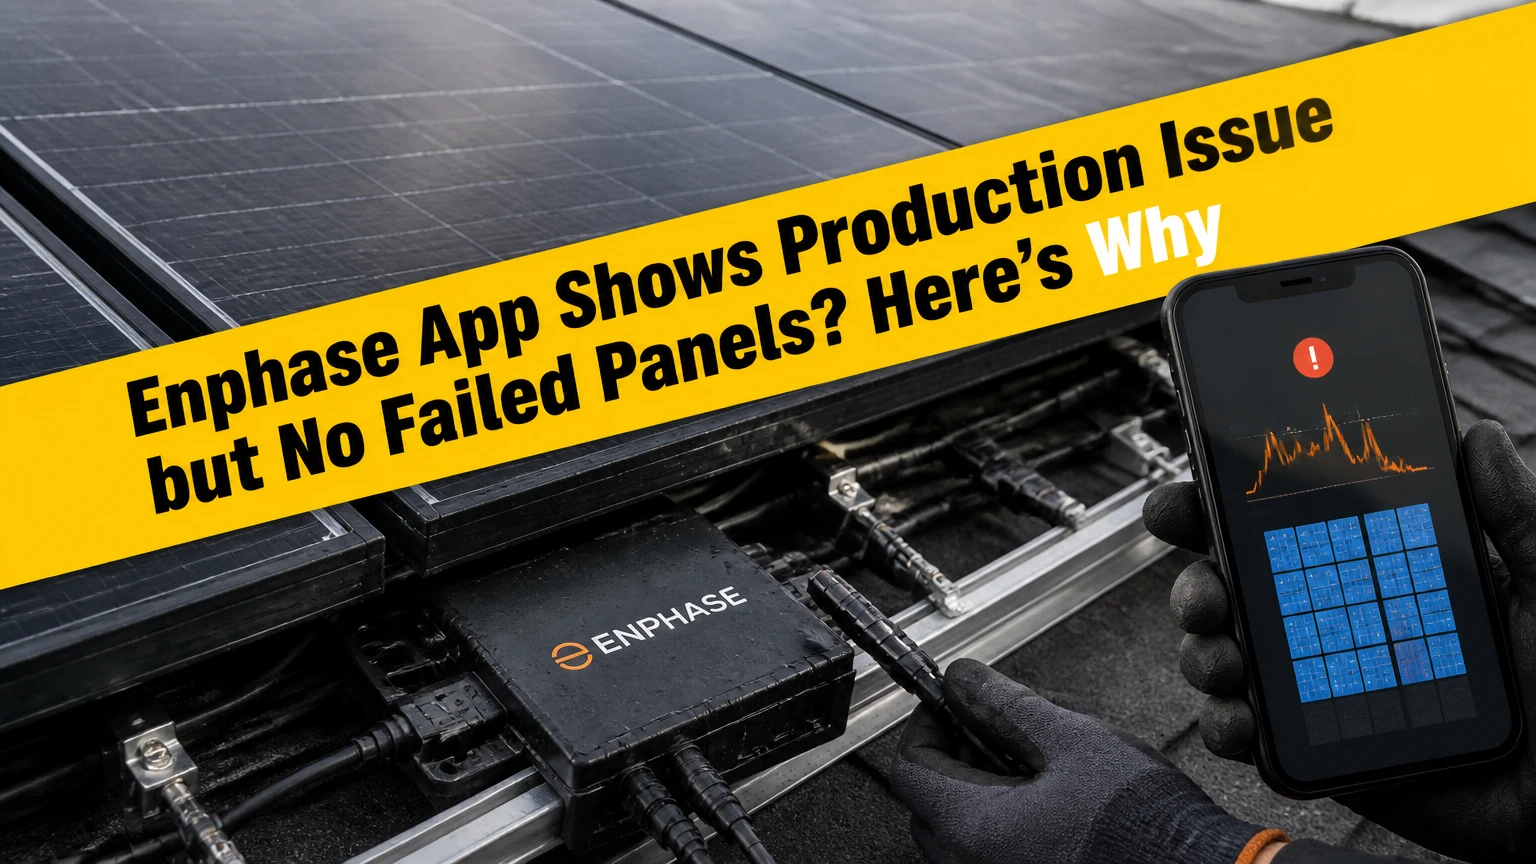
An Enphase App “Production Issue” alert usually means the system produced less energy than its software expected over a monitoring period, not that a panel or microinverter failed. All devices can communicate normally while shade, soiling, weather, grid voltage, inverter temperature, curtailment, or a monitoring configuration problem reduces measured output.
Key Facts at a Glance
Enphase panel communication confirms data transfer, not full-power operation.
A production alert compares measured energy with an expected baseline that varies by system and conditions.
Shade, snow, dirt, and utility voltage can reduce output without creating a failed-microinverter message.
A production CT error usually distorts consumption or net-energy readings rather than the photovoltaic array’s actual generation.
Cloudy weather can make an alert less meaningful when the modeled baseline does not match short-term conditions.
Repeated alerts on clear days deserve an installer review, especially when the same panel group underperforms.
Why Enphase App Shows Production Issue but No Failed Panels
The Enphase App can report a production problem when the monitoring system sees an energy shortfall but receives normal status messages from the microinverters. Communication answers “is the device talking?” Production analysis asks “did the array deliver the expected amount of energy?” Those are separate tests.
The Enphase IQ Gateway, formerly called the Envoy on many installations, gathers inverter telemetry and sends it to Enlighten. The application then compares production with a modeled or historical expectation. The expected value can be affected by array size, orientation, tilt, location, weather data, season, system age, and configured settings.
A useful field distinction is this: a failed-panel warning normally points toward a device-level fault, while a production alert points toward an energy-level deviation. The two alerts can overlap, but one does not automatically prove the other.
Is the 90% threshold universal?
No. A 90% comparison and a 24-72-hour persistence period are useful troubleshooting references, but homeowners should not treat them as universal Enphase rules for every firmware version, service configuration, or alert type. Enphase does not publish one public threshold that governs every production notification.
Installers and monitoring providers may configure alert logic differently. Weather-model uncertainty also matters. A roof with west-facing modules can appear weak in a morning snapshot even though its full-day output is normal, while a heavily clouded day can make a short comparison unreliable.
The right question is whether the shortfall repeats under comparable conditions. Compare daily kilowatt-hours on clear days against nearby clear days, rather than judging one cloudy afternoon.
How does Enphase estimate expected production?
Enphase expected production is an estimate, not a laboratory measurement of the power available at every panel. The estimate uses system configuration and time-based production patterns, while actual output depends on irradiance, module temperature, angle of sunlight, shading, inverter limits, and grid availability.
Photovoltaic output changes continuously. A 6-kilowatt system does not produce 6 kilowatts from sunrise to sunset, and its daily energy can vary substantially between two days in the same month. The National Renewable Energy Laboratory’s PVWatts model similarly treats solar production as dependent on location, weather, tilt, azimuth, system losses, and temperature rather than nameplate capacity alone.
A panel can therefore report correctly while producing less than its rating. Microinverters commonly reduce output when their input conditions or the AC grid fall outside permitted operating conditions. The monitoring platform may correctly record that reduction without identifying a component failure.
What does panel communication prove?
Panel communication proves that the microinverter transmitted data to the gateway during the reporting interval. It does not prove that the module received equal sunlight, reached its rated power, avoided clipping, or operated without temporary curtailment.
A useful diagnostic is the panel-level graph. If every module drops at the same time, suspect weather, grid conditions, or system-level control. If one roof section drops in a repeatable shape, investigate shade, soiling, a connector, a module, or a microinverter. Pattern matters more than the color of a single status icon.
| App observation | More likely interpretation | First verification | Typical escalation |
|---|---|---|---|
| All panels communicate, whole array is low | Weather, grid, curtailment, baseline error | Compare clear-day daily kWh | Installer or utility |
| One panel is repeatedly low | Local shade, module, connector, microinverter | Compare neighboring panel graphs | Installer |
| Output stops at midday | Grid event, gateway issue, thermal limit | Check event log and Live Vitals | Installer, then utility |
| Output looks normal but alert remains | Stale alert or modeled-baseline mismatch | Review several full days | Monitoring provider |
| Production is normal, consumption is wrong | CT placement, polarity, or mapping | Compare meter and app values | Installer |
Which conditions reduce production without failing panels?
Environmental conditions are the most common non-hardware explanation. Shade from a growing tree, chimney, vent, antenna, nearby building, or seasonal sun angle can reduce one module for part of the day while the microinverter remains healthy.
Soiling has a similar effect. Dust, pollen, bird deposits, leaves, and snow reduce irradiance at the glass surface. The impact varies by deposit location and rainfall. A narrow bird dropping can create a disproportionate local hotspot risk in some module designs, so owners should not scrape hardened material with abrasive tools.
Temperature also changes output. Silicon modules generally lose power as cell temperature rises, while microinverters may reduce output when their internal electronics become hot. Enphase operating limits differ by product, installation, firmware, and ambient conditions, so 85°C should not be treated as a universal trigger. The installer should use the model-specific documentation and event records.
Could cloudy weather trigger the alert?
Yes, cloudy weather can contribute to a production alert, particularly when the comparison period is short or the baseline assumes clearer conditions. A single gray day is weak evidence of a fault. A persistent pattern across several comparable clear days is much stronger evidence.
Weather does not explain every alert. If one panel remains low on clear days while adjacent panels receive the same sunlight, the problem is localized. If the whole array falls together and the event log records grid interruptions, voltage or utility conditions deserve priority.
Can grid voltage reduce Enphase production?
Yes. High or unstable AC voltage can cause Enphase microinverters to limit power or disconnect temporarily to comply with their configured grid protection requirements. The often-cited 264-volt figure is not a universal diagnostic limit because permitted voltage ranges depend on interconnection rules, region, grid profile, and equipment configuration.
Voltage rise becomes more likely when a solar system exports substantial power through a long service conductor, when neighborhood solar production is high, or when the utility transformer is already operating at an elevated voltage. The inverter may restart after the voltage returns to an acceptable range, creating repeated midday gaps.
Do not open electrical equipment or change the grid profile yourself. A licensed installer can review AC voltage records, event codes, conductor sizing, terminations, and the configured profile. The utility may need to measure voltage at the service point, because a homeowner’s app reading does not replace a utility-quality investigation.
| Possible cause | Observable pattern | Safe homeowner check | Professional remedy |
|---|---|---|---|
| High grid voltage | Midday stops or repeated voltage events | Review event times and voltage history | Utility measurement or installer test |
| Low grid voltage | Startup failures or brief dropouts | Check whether outage coincided | Utility and installer diagnosis |
| Long AC run | Problem worsens during high export | Compare morning and midday output | Installer voltage-drop assessment |
| Loose termination | Irregular dropouts, possible heat damage | Do not remove covers | Licensed electrical inspection |
| Incorrect grid profile | Persistent restriction after commissioning | Record model and event code | Installer or Enphase support |
Does a production CT error cause the alert?
Usually, no. A production CT, or current transformer, measures current for system monitoring, but CT configuration errors more commonly distort consumption, net-energy, or import/export readings than the actual energy generated by the microinverters. A reversed or misplaced consumption CT can make the app’s energy-flow diagram look impossible without reducing photovoltaic output.
The distinction depends on the installation architecture. Some systems use metering hardware and software settings that influence how production or consumption data is presented, so an installer should verify the exact CT type, phase mapping, polarity, and firmware. The app’s “production” number should be compared with gateway or inverter telemetry, not assumed correct solely because the CT appears installed.
A practical test is to compare the utility meter’s net export with the app’s production and consumption values over a full day. A mismatch in accounting points toward metering or configuration. A mismatch in inverter-level output points toward generation, grid, or environmental conditions.
How should you troubleshoot the alert safely?
Use six checks, beginning with data and ground-level observation. The process commonly takes 20-45 minutes of homeowner time, but electrical testing and rooftop work belong to qualified professionals.
Step 1: Record the alert and time range
Write down when the alert began, whether it repeats, the weather, and the daily production in kilowatt-hours. Save screenshots of the system overview, panel-level view, event log, and any voltage or communication message.
You will know this step is useful when you can compare at least two similar days. A common mistake is judging production from instantaneous watts, which naturally fall in the morning, afternoon, and during cloud passage.
Step 2: Compare panel-level patterns
Open the Enphase App or Enlighten website and compare the lowest-producing modules with neighboring modules having similar orientation. Look for repeated differences, synchronized drops, and gaps during the same hours.
You will know the pattern is meaningful when it persists across clear days. A common mistake is comparing an east-facing panel with a south-facing panel at noon and calling the difference a failure.
Step 3: Inspect from the ground
Look for visible leaves, snow, heavy dust, bird deposits, new shade, or objects placed near the array. Do not climb onto a roof or walk on modules merely to inspect them.
You will know environmental causes are plausible when the shaded or dirty area matches the low-producing panel group. A common mistake is using a metal scraper or pressure washer, which can damage glass, seals, frames, or wiring.
Step 4: Review events and Live Vitals
Where the account provides access, inspect event history and Live Vitals for voltage, communication gaps, and repeated inverter stops. Menu names vary between the Enphase App, Enlighten web interface, installer view, and software versions.
You will know grid conditions deserve escalation when several microinverters log voltage-related events at similar times. A common mistake is interpreting a green communication indicator as proof that AC production remained uninterrupted.
Step 5: Check gateway connectivity
Confirm that the IQ Gateway has stable internet and that its local status indicators match the product manual. A communication delay can make the app display stale information, although a stale dashboard does not itself explain genuine low generation.
You will know a data issue is likely when gateway data catches up and historical production appears normal. A common mistake is deleting the system or changing configuration settings before preserving the event history.
Step 6: Perform only an authorized restart
If the installer or Enphase support instructs you to restart the gateway, follow the site-specific shutdown sequence and the IQ Gateway manual. Do not remove covers, handle live conductors, or switch breakers whose purpose you cannot identify.
A restart may clear a temporary communication state, but it cannot remove shade, correct high utility voltage, repair a connector, or recalibrate incorrectly installed CTs. You will know it helped when new data arrives consistently and the alert does not return after comparable production days.
Which resolution option fits the cause?
The best resolution depends on whether the energy is genuinely missing or only misreported. Cleaning is appropriate for confirmed soiling, while a gateway restart is appropriate only for a suspected data-state problem. Grid events and persistent panel-level differences require professional diagnosis rather than repeated resets.
| Resolution path | Typical direct cost | Typical time | Suitable evidence |
|---|---|---|---|
| Ground inspection | $0 | 20-45 minutes | Visible shade or debris |
| Professional panel cleaning | $150-$350 | 1-3 days | Confirmed heavy soiling |
| Installer diagnostic visit | $150-$300, often warranty-covered | 3-7 days | Repeated clear-day shortfall |
| Gateway or firmware support | $0-$150 | 1-3 days | Stale data or communication issue |
| Utility voltage investigation | $0 to customer, location-dependent | 2-14 days | Repeated voltage events |
| CT verification or recalibration | $150-$300 | 3-7 days | Metering mismatch or wrong phase |
Typical prices vary by region, roof access, warranty terms, travel distance, and whether the original installer remains available. A cleaning quote is not a substitute for inverter event analysis when the array is clean and the alert repeats.
When should you call the installer?
Contact the installer after two or three comparable clear production days with the alert still present, immediately when panel-level output shows a persistent outlier, or whenever the event log shows repeated grid or inverter faults. Provide screenshots, dates, weather, daily kWh, system address, gateway model, and serial-number information.
Call the utility when the installer confirms abnormal service voltage or when multiple solar systems in the area show simultaneous midday interruptions. The utility generally controls the service voltage, while the installer controls system wiring, configuration, and equipment diagnosis.
What edge cases make the alert misleading?
A new installation can generate confusing alerts while the installer completes commissioning, updates firmware, or corrects the system profile. Ask whether the array size, module count, orientation, and permission-to-operate status are correctly represented.
Seasonal changes also matter. A baseline created from previous production may not perfectly model winter snow, wildfire haze, monsoon clouds, or unusual heat. A production issue that appears only during a weather anomaly should be interpreted differently from one that returns every sunny day.
Clipping is another non-failure condition. If the DC array can produce more power than the AC microinverter or system output limit, the graph may flatten near the inverter’s rated ceiling. Clipping reduces visible peak power but does not indicate a failed panel.
| Situation | Why the app may flag concern | How to distinguish it | Correct response |
|---|---|---|---|
| First week after commissioning | Incomplete baseline or configuration | Check commissioning status | Ask installer to verify setup |
| Winter snow | Irradiance blocked at module surface | Ground-level visual check | Remove safely or hire service |
| Wildfire haze | Regional irradiance reduction | Compare weather and nearby systems | Monitor until conditions normalize |
| Hot summer afternoon | Thermal or voltage curtailment | Review event time and voltage | Installer or utility review |
| Oversized DC array | AC clipping at midday | Flat output near rated AC limit | No repair if design is intentional |
| Internet outage | Delayed or stale dashboard data | Check local gateway and later history | Restore network, preserve records |
What the alert is not good at telling you
The Enphase App is not a substitute for an irradiance measurement, insulation test, utility power-quality recorder, or physical inspection of rooftop wiring. App estimates are excellent for identifying patterns, but they cannot reliably identify every cause from a single status label.
The app also cannot prove that a module is electrically healthy simply because its microinverter communicates. Conversely, a low daily number cannot prove that a module failed when clouds, shade, voltage, or clipping affected the entire array.
The strongest practitioner rule is to triangulate three signals: panel-level production, inverter event codes, and comparable-day energy. A conclusion based on only one signal creates avoidable service calls.
FAQ
Will a production issue damage my solar panels?
Usually, no. A production alert is a monitoring or performance indication, not a damage diagnosis. Grid-related shutdowns and thermal limits are protective behaviors designed to keep equipment within operating requirements, but repeated faults still deserve investigation because lost production can accumulate and an underlying wiring or utility problem may remain.
How long can I wait before reporting the alert?
Wait one or two comparable clear days only when the system has no hardware or grid fault messages and production appears broadly normal. Report the issue promptly when the alert lasts three clear days, one panel remains substantially below its neighbors, or repeated voltage events interrupt midday production.
Can rain fix a Production Issue?
Rain can remove light dust and pollen, but it may not remove bird deposits, oily residue, or hardened dirt. Rain also cannot correct shade, high grid voltage, incorrect CT mapping, a loose connector, or an inverter temperature problem. Compare production after the next clear day rather than assuming rainfall resolved the cause.
What information will an installer need?
Send the alert start date, daily kilowatt-hours, panel-level screenshots, event codes, gateway model, system address, weather conditions, and any recent roof or electrical changes. Mention whether the alert appeared after installation or after months of normal operation, because commissioning errors and aging-system faults require different checks.
Is a failed panel always shown as a panel failure?
No. A module or microinverter fault may first appear as low panel-level production, an intermittent event, or a system production alert. The absence of a named failed panel narrows the diagnosis but does not eliminate hardware problems. Repeated outlier behavior on clear days warrants installer testing.
The Bottom Line
An Enphase App Shows “Production Issue” but No Failed Panels when measured system energy falls below the platform’s expected pattern even though microinverters continue communicating. Start with comparable-day and panel-level data, then inspect shade and soiling, review event and voltage records, and use a gateway restart only when authorized. Escalate persistent clear-day shortfalls to the installer, and involve the utility when voltage events affect multiple inverters.